Home » Archives for Admin » Page 2
-
Posted on November 6, 2023
-
/Under Diagram
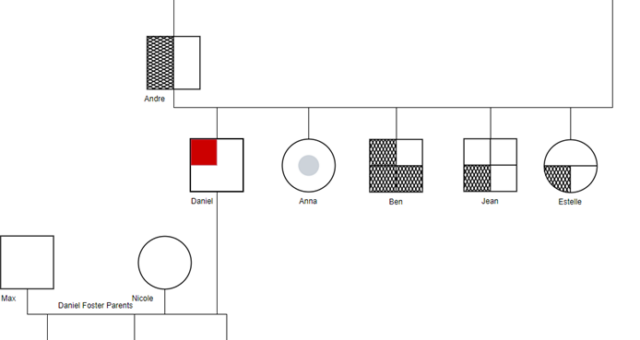
Introduction Family trees have long been used as visual representations of one's lineage, showcasing names, relationships, and connections through generations. While traditional family trees provide a basic overview, they often fall short when it comes to capturing the intricate dynamics, major events, and unique relationships within a family. This is where genograms step in—a more detailed and insightful approach to mapping out family histories. Understanding Genograms A genogram is not just a family tree; it's a dynamic and comprehensive family map that utilizes special symbols to convey a wealth of information. This innovative…
continue reading →
-
Posted on November 6, 2023
-
/Under Chart
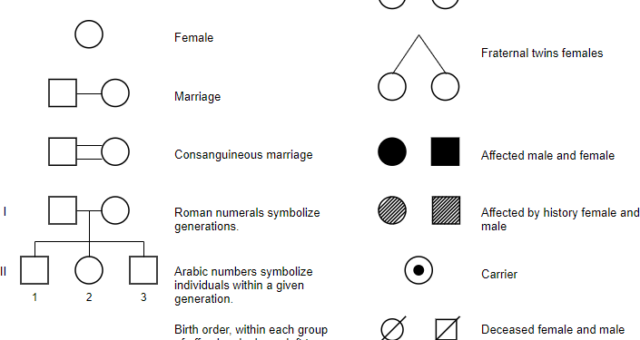
Introduction In the intricate tapestry of genetics, the pedigree chart stands as a vital tool, allowing geneticists to navigate through the threads of inheritance, unraveling the story of traits passed down from one generation to the next. Whether applied to humans, show dogs, or racehorses, the pedigree chart serves as a visual roadmap, illuminating the occurrence and appearance of specific genes or organisms and their ancestors. This comprehensive article aims to delve into the significance of pedigree charts, exploring their role in tracing inherited traits, especially in the context of human genealogy. Understanding…
continue reading →
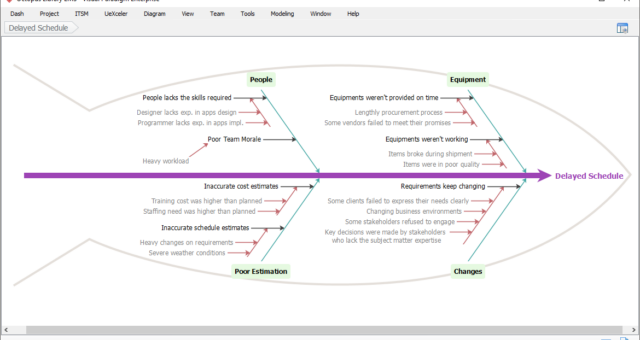
Introduction Cause and effect analysis is a powerful tool that allows individuals and teams to understand the intricate relationships between events or elements in a system. At the heart of this analytical approach lies the Fishbone Diagram, also known as the Cause and Effect Diagram or Ishikawa Diagram. This visual representation helps organize information and fosters a comprehensive exploration of potential causes and effects related to a specific problem. Understanding the Fishbone Diagram Purpose and Structure: The Fishbone Diagram serves as a visual representation of cause-and-effect relationships. It organizes a vast amount of…
continue reading →
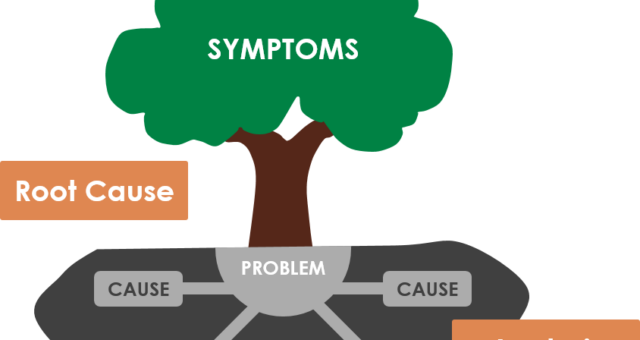
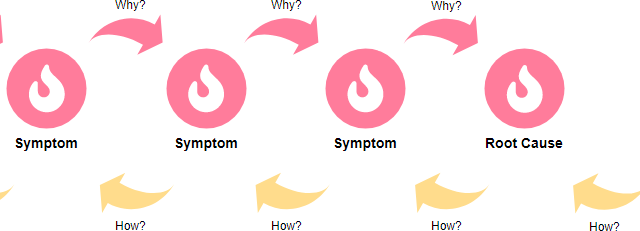
Introduction In the intricate dance of problem-solving, the ability to ask the right questions often determines the quality of the solutions obtained. One powerful and elementary approach to problem-solving is the "5 Whys" technique, a method that encourages deep thinking through persistent questioning. Originally developed by Sakichi Toyota within the Toyota Motor Corporation, this technique has proven its efficacy in swiftly identifying the root causes of problems. In this article, we will delve into the mechanics of the 5 Whys and explore its application in real-life problem-solving scenarios. The 5 Whys Strategy The…
continue reading →
Introduction Root cause analysis is a pivotal aspect of problem-solving, and the 5 Whys technique has proven to be an invaluable tool in uncovering the underlying issues behind a problem. In this guide, we'll explore how Visual Paradigm, a robust diagramming tool, can be employed to create visually engaging and insightful 5 Whys infographics. By seamlessly integrating the power of Visual Paradigm with the systematic approach of the 5 Whys, we aim to provide a comprehensive framework for efficient root cause analysis. What is 5 Whys Analysis? The 5 Whys is a powerful…
continue reading →
-
Posted on November 6, 2023
-
/Under Diagram
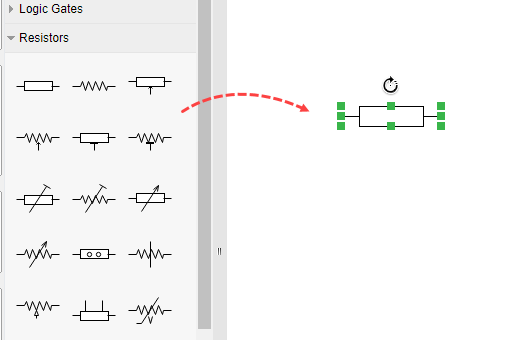
Introduction In the world of electronics, a well-crafted circuit diagram is the key to unlocking the mysteries of electrical circuits. Whether you're a seasoned engineer or a budding enthusiast, Visual Paradigm Online offers a powerful tool to simplify the process of creating circuit diagrams. In this article, we'll explore what a circuit diagram is, its significance, and guide you through the steps to create one using Visual Paradigm Online. What is a Circuit Diagram? A circuit diagram, also known as an elementary diagram, electrical diagram, or electronic schematic, is a visual representation of…
continue reading →
-
Posted on November 6, 2023
-
/Under Diagram
Introduction In the dynamic world of database design, having a reliable and user-friendly Entity Relationship Diagram (ERD) tool is essential. Visual Paradigm Online (VP Online) Free Edition stands out as an exceptional choice for those seeking a free and powerful ERD tool. Let's explore the key features and benefits that make VP Online an ideal option for creating professional-quality ER diagrams without breaking the bank. Unparalleled Freedom One of the standout features of VP Online Free Edition is its commitment to providing users with complete freedom. There are no limitations on the number…
continue reading →
-
Posted on October 13, 2023
-
/Under Diagram
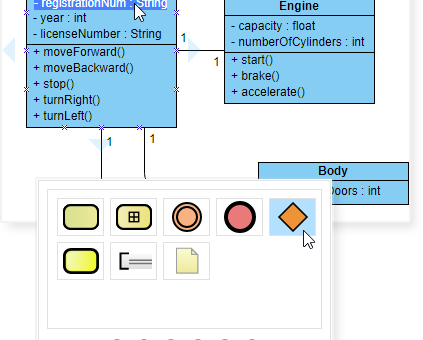
Introduction Unified Modeling Language (UML) Component diagrams serve as invaluable tools in the world of object-oriented systems, offering a means to visualize, specify, and document component-based systems. These diagrams play a crucial role in constructing executable systems through both forward and reverse engineering processes. In this exploration, we will delve into the intricacies of UML Component diagrams, unraveling their significance, structure, and key concepts. What is a Component Diagram? At its core, a Component diagram is a variant of the class diagram that zeros in on the physical aspects of object-oriented systems. It…
continue reading →
What is Sequence Diagram A sequence diagram is a visual representation that illustrates the interactions and order of events between different components or objects in a system over a specific period. It's a crucial tool in Unified Modeling Language (UML) for depicting the dynamic aspects of a system. In a sequence diagram: Lifelines: Represent entities or objects involved in the interaction. Messages: Show communication or interaction between lifelines, often indicating the flow of control or data. Activation Bars: Indicate the time during which a lifeline is active or performing an action. Sequence diagrams…
continue reading →
-
Posted on October 13, 2023
-
/Under Diagram
Introduction In the dynamic world of software development, creating clear and concise UML diagrams is crucial for effective communication and successful project implementation. For those seeking a free, web-based UML software solution, Visual Paradigm Online emerges as a perfect blend of simplicity and powerful functionality. This article explores why Visual Paradigm Online has become one of the most popular choices for UML diagramming enthusiasts. The Visual Paradigm Online Free Edition Visual Paradigm Online Free Edition is a treasure trove for individuals seeking a robust UML diagramming tool without breaking the bank. Whether you're…
continue reading →