Home » Archives for vpwing
Looking for a hassle-free and cost-effective solution to convert CBZ files to PDF format? Visual Paradigm Online has you covered. With its suite of intuitive and user-friendly tools, Visual Paradigm Online offers a straightforward method to transform your CBZ files into PDFs, all without any charge. Whether you're a comic enthusiast, an e-book reader, or someone in need of converting CBZ files for professional or personal use, this article will walk you through the process step by step, ensuring that you can effortlessly convert your CBZ files to PDF format with ease and…
continue reading →
Visual Paradigm Online offers a suite of powerful tools, including a versatile flipbook maker and a dynamic slideshow maker, designed to enhance your presentations and visual storytelling. One of the standout features of these tools is the ability to update your work without altering the original URL. In case you find that your flipbook or slideshow does not reflect your modifications despite utilizing this feature, this article will guide you through the steps to troubleshoot and ensure that your creations are updated as intended! Updated Flipbook According to The Modification https://www.youtube.com/watch?v=mfajAjrMyrg After we…
continue reading →
Numbered items play a ubiquitous role in our designs and work. As a default feature, they can sometimes present technical challenges, such as extending beyond the borders of our elements. In this article, we'll guide you through a few simple steps to rectify this issue in Visual Paradigm Online and ensure your numbered items stay neatly within their designated boundaries. Avoid Numbered Item Render Out of Element's Border https://youtu.be/IXltOAyRh24 When there are numbered item more than 10, the numbered item may overlap, or even outside the left border of the shape. We can…
continue reading →
-
Posted on March 22, 2024
-
/Under Mind Map
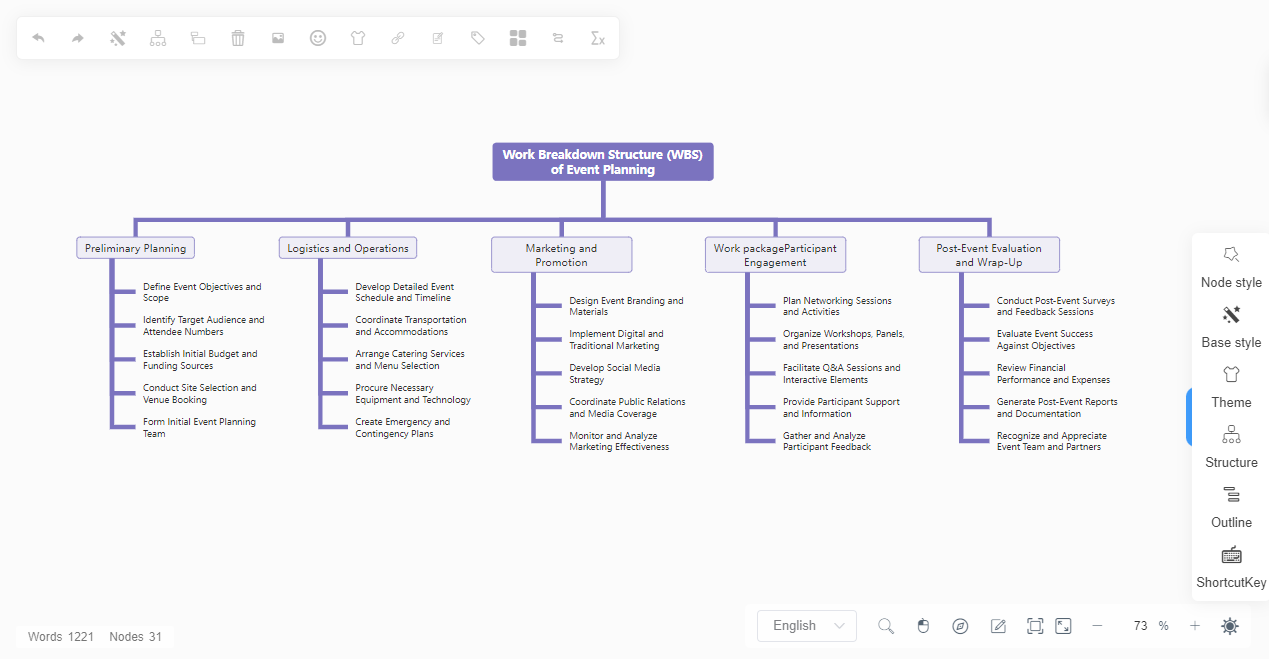
The Work Breakdown Structure (WBS) Diagram is a powerful tool for organizing and visualizing project tasks and deliverables. With Visual Paradigm Smart Board, creating a WBS diagram is a straightforward process that allows users to define project scope, break down work into manageable components, and establish clear relationships between tasks. In this article, we will explore how to leverage the WBS diagram feature in Visual Paradigm Smart Board to streamline project planning and execution. More About A Breakdown Structure Diagram The Work Breakdown Structure Diagram is an essential tool used in project management…
continue reading →
In today's digital age, the sharing of content has become more diverse and convenient. In Visual Paradigm Online, the flipbook maker helps you to create attractive digital flipbook in an easy way, while the digital bookshelf provide a platform to display your work. Now, we introduce another feature: QR code sharing. This allows you to share your digital bookshelf quickly and efficiently by generating a QR code. Discover how to utilize this feature in this article. Why We Need A QR Code QR codes offer several advantages over URLs in certain situations. Firstly,…
continue reading →
Visual Paradigm Publication Server is a powerful platform designed to host and manage a variety of digital publications, including flipbooks and slideshows. Whether you are sharing business presentations, educational materials, or creative projects, the Publication Server offers a centralized solution for self-hosting, ensuring complete control over accessibility and security. Same as the workspace of Visual Paradigm Online, we are able to manage and display your work in a digital bookshelf. In this article, we will demonstrate how to manage and display your work in a digital flipbook using the Visual Paradigm Publication Server,…
continue reading →
Visual Paradigm Publication Server is a robust platform designed to host and manage your digital publications with ease and efficiency. Whether you're sharing flipbooks, slideshows, or other interactive content, the Publication Server provides a centralized solution for self-hosting, ensuring complete control over accessibility and security. Customize the default port number of the Publication Server to better suit your specific requirements. It is a task we can accomplish, and we are here to guide you through the process here. What is Port Number A port number is a numerical identifier assigned to network connections…
continue reading →
Visual Paradigm Online Slideshow Maker is a versatile tool that empowers you to create captivating digital presentations with ease. Whether you're delivering a business pitch, showcasing educational content, or presenting creative projects, Visual Paradigm provides the tools you need to captivate your audience. With the Publication Server, users can self-host their slideshows, ensuring complete control over accessibility and security. In this article, we will demonstrate how to seamlessly update your slideshow on the Publication Server without changing its URL, ensuring a smooth and uninterrupted experience for your audience! Visual Paradigm Slideshow Maker Visual…
continue reading →
Digital flipbooks serve as powerful tools for sharing ideas and showcasing works to a broader audience in an engaging and interactive manner. With the Visual Paradigm Publication Server, users can seamlessly self-host their flipbooks, ensuring greater control over accessibility and security. However, there may come a time when you need to update your flipbook without altering its URL. This task is easily achievable, and we are here to guide you through the process. In this article, we will show you how to effortlessly update your flipbook on the Publication Server while retaining its…
continue reading →
Visual Paradigm Online provides the Publication Server, which helps you effortlessly host and manage your digital publications. Whether it's sharing flipbooks or slideshows, the Publication Server offers a versatile solution for seamless publication and distribution. You can configure the Publication Server to become a system service, ensuring automatic startup upon machine boot. In this article, we will guide you through the steps to achieve this configuration, streamlining the process for enhanced convenience and efficiency. Make Publication Server become System Service https://www.youtube.com/watch?v=mMN9SOCT7fk First of all, we need to run the Command prompt as administrator.…
continue reading →


