

The Chart module provides a flexible, data-driven visualization tool designed to transform raw numbers into clear, professional insights. Our platform offers two distinct ways to create and use charts depending on your specific presentation needs:
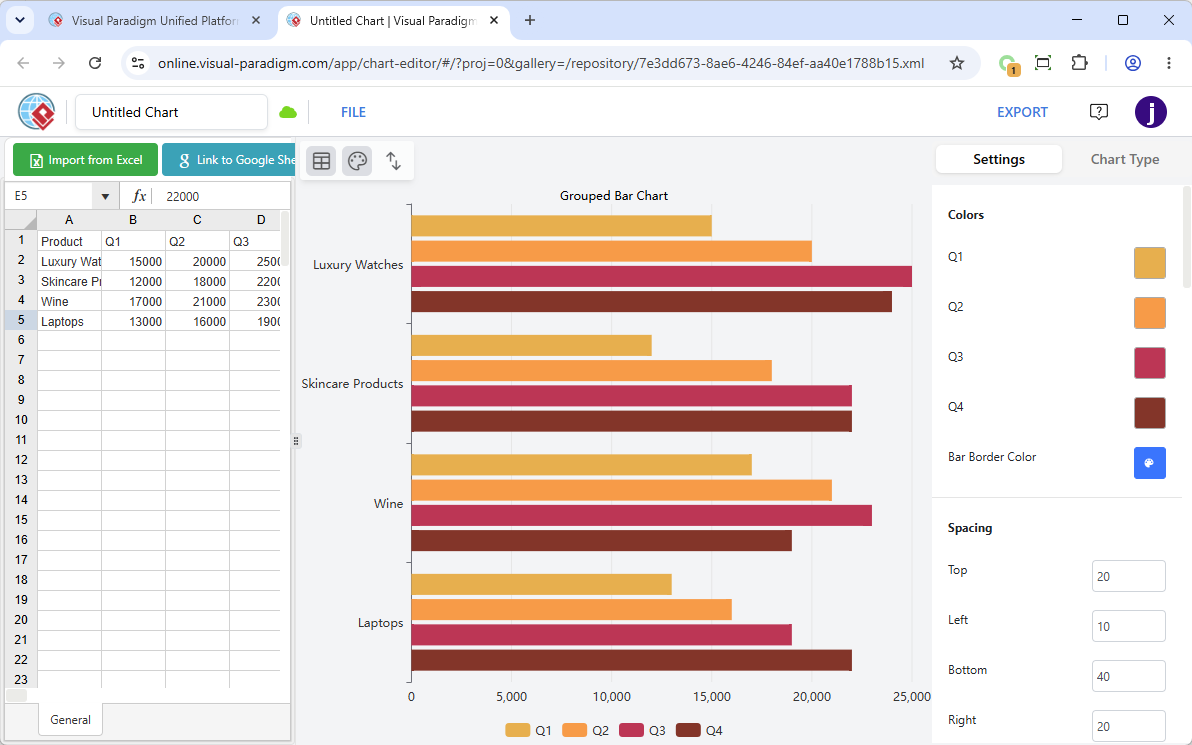
- Standalone Chart Maker: This “atomic” tool allows you to create a single, clean chart quickly. You input your data, choose your chart type (such as bar, line, pie, radar, or scatter plots), customize the styling, and generate a standalone visual asset ready for immediate export or embedding.
- Infographic Charts: For a more comprehensive presentation, you can create a one-page chart infographic. This option wraps your data chart into a beautiful, professionally designed layout that combines the chart itself with supporting textual information, icons, and contextual graphics to tell a complete data story.

Both options feature an easy-to-use spreadsheet interface for data input and provide a wide selection of customizable templates to match your reporting or branding requirements. All generated charts are saved directly to your centralized workspace within the Unified Platform.
