
Visual Paradigm: A Comprehensive UML Modeling Solution
In the dynamic world of software development, having a powerful and user-friendly UML modeling tool is crucial for designing, communicating, and documenting complex systems. Among the leading options in the market, Visual Paradigm stands out as a comprehensive and versatile solution that ...
Read More
Read More

UML Building Blocks and Diagrams (UML 2.6)
UML (Unified Modeling Language) is a standard language for describing the design of software systems. As UML describes real-time systems, it is important to create a conceptual model and gradually build upon it. The conceptual model of UML can be ...
Read More
Read More
ATM System UML Visual Modeling: A Case Study
Introduction Automated Teller Machines (ATMs) have become an integral part of modern banking and financial services. As the demand for convenient and accessible banking solutions continues to grow, the need for robust and efficient ATM systems has become more critical ...
Read More
Read More

🚀 Unleash Your Potential with Smart Board: The Ultimate FREE Mind Mapping Tool! 🚀
🌟 Introducing Smart Board by Visual Paradigm 🌟 Experience the future of mind mapping with our cutting-edge, user-friendly, and entirely FREE tool designed to simplify complexity and supercharge your thinking process. Smart Board empowers users to unlock their creativity and ...
Read More
Read More
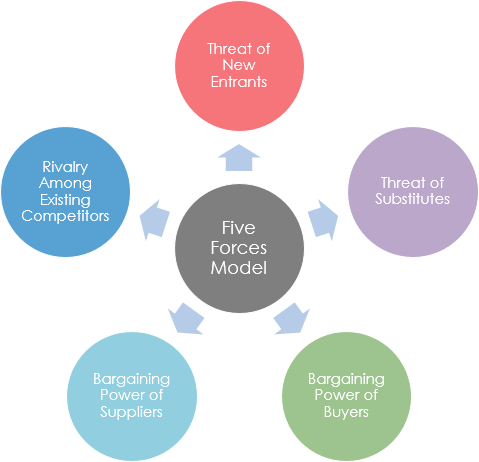
Porter’s Five Forces: A Comprehensive Guide to Analyzing Industry Competition
The Porter's Five Forces analysis model, developed by renowned Harvard Business School professor Michael E. Porter, has been a cornerstone of strategic management since its publication in the Harvard Business Review in 1979. This influential framework has transformed the way ...
Read More
Read More
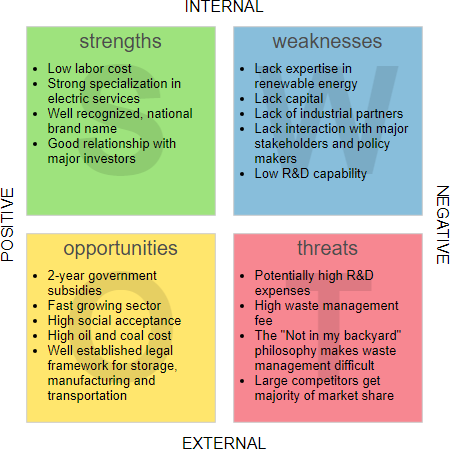
Case Study: SWOT Analysis of a Waste Management Company
Introduction In this case study, we will explore a SWOT (Strengths, Weaknesses, Opportunities, Threats) analysis for a waste management company. The SWOT analysis is a strategic planning tool used to identify the internal and external factors that can impact an ...
Read More
Read More
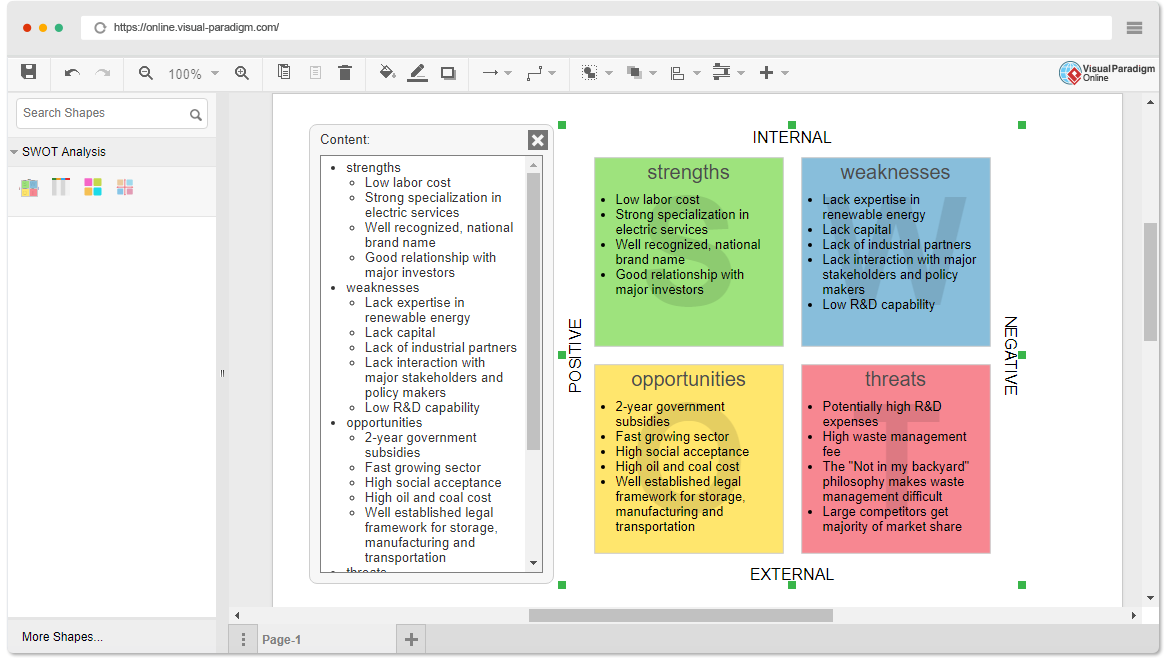
Energizing Growth: A Comprehensive SWOT Analysis for ABC Company
Introduction In the dynamic and competitive energy sector, a thorough understanding of the internal and external environment is crucial for strategic decision-making. SWOT analysis, an acronym for Strengths, Weaknesses, Opportunities, and Threats, is a powerful tool that helps businesses identify ...
Read More
Read More


