How to Avoid Numbered Item Render Out of Element's Border

How to Avoid Numbered Item Render Out of Element’s Border

Numbered items play a ubiquitous role in our designs and work. As a default feature, they can sometimes present technical challenges, such as extending beyond the borders of our elements. In this article, we'll guide you through a few simple steps to rectify this issue in Visual Paradigm Online and ensure your numbered items stay neatly within their designated boundaries. Avoid Numbered Item Render Out of Element's Border https://youtu.be/IXltOAyRh24 When there are numbered item more than 10, the numbered item may overlap, or even outside the left border of the shape. We can…continue reading →
Beginner’s Guide to Activity Diagrams with Visual Paradigm Online

Beginner’s Guide to Activity Diagrams with Visual Paradigm Online

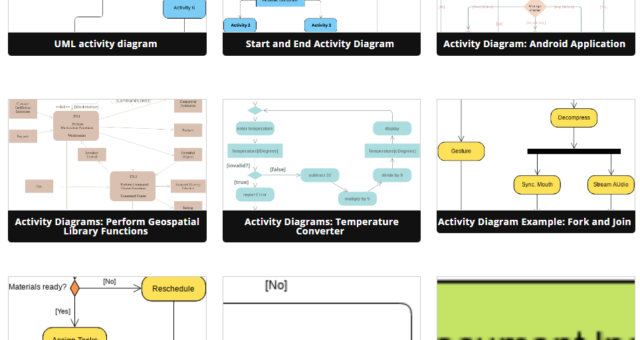
Introduction Activity diagrams are a vital tool in the world of software engineering and business process modeling. They help you visualize and understand the flow of activities within a system, process, or workflow. Visual Paradigm Online, a popular diagramming tool, offers a wide range of templates and features to help you create activity diagrams effectively. In this beginner's guide, we'll introduce you to activity diagrams and demonstrate how to use Visual Paradigm Online's extensive template library to learn and create your own diagrams. What is an Activity Diagram? An activity diagram is a…continue reading →
Beginner’s Guide to Deployment Diagrams with Visual Paradigm Online

Beginner’s Guide to Deployment Diagrams with Visual Paradigm Online

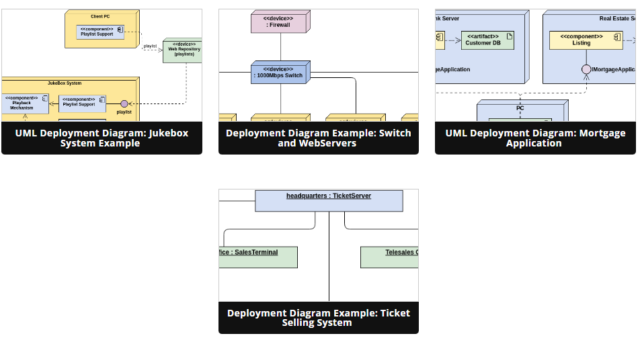
Introduction Deployment diagrams are an essential tool in software engineering that allow you to visualize and understand how software components and hardware elements interact within a system. They help you plan the deployment of your software application across different servers, devices, and environments. In this beginner's guide, we'll introduce you to deployment diagrams and show you how to create them using Visual Paradigm Online, a user-friendly diagramming tool with a wide range of templates and examples. What is a Deployment Diagram? A deployment diagram in software engineering is a type of UML (Unified…continue reading →
Beginner’s Guide to Package Diagrams with Visual Paradigm Online

Beginner’s Guide to Package Diagrams with Visual Paradigm Online

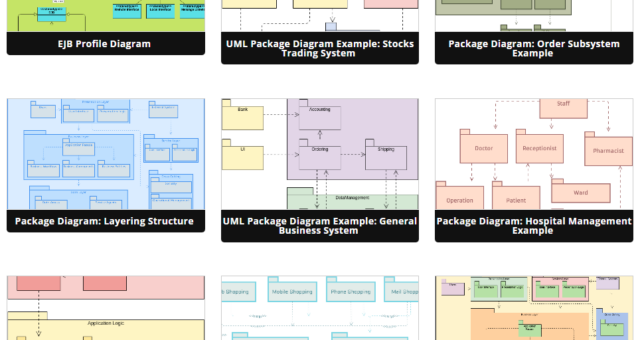
Introduction Package diagrams are an essential tool in software engineering, helping you organize and visualize the structure of your software system. They are part of the Unified Modeling Language (UML) and provide a high-level view of how different elements in your system are grouped into packages. In this beginner's guide, we will introduce you to package diagrams and demonstrate how to create them using Visual Paradigm Online, a powerful online diagramming tool with a large collection of templates. What is a Package Diagram? A package diagram is a UML diagram that represents the…continue reading →
Beginner’s Guide to Sequence Diagrams with Visual Paradigm Online

Beginner’s Guide to Sequence Diagrams with Visual Paradigm Online

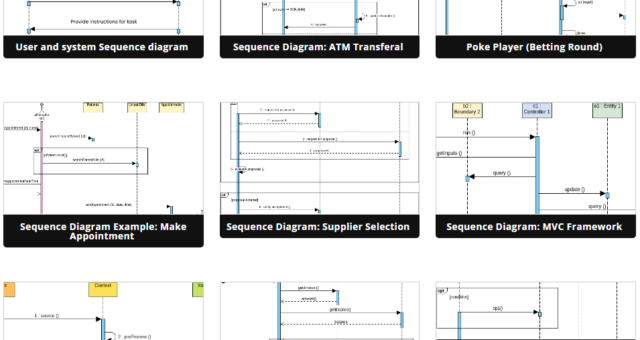
Introduction Sequence diagrams are powerful tools in software development for visualizing the interactions between objects or components in a system over time. They help you understand how various parts of your system communicate and collaborate. In this beginner's guide, we'll introduce you to sequence diagrams and show you how to create them using Visual Paradigm Online, a user-friendly online diagramming tool with a collection of templates that make learning easy through practical examples. What is a Sequence Diagram? A sequence diagram is a type of UML (Unified Modeling Language) diagram that represents the…continue reading →
Beginner’s Guide to Data Flow Diagrams (DFD) with Visual Paradigm Online

Beginner’s Guide to Data Flow Diagrams (DFD) with Visual Paradigm Online

Introduction Data Flow Diagrams (DFD) are a powerful visual tool for representing and analyzing the flow of data within a system or process. They help in understanding how data moves through different components and processes, making it easier to identify bottlenecks, inefficiencies, and opportunities for improvement. In this beginner's guide, we will introduce you to Data Flow Diagrams and show you how to create them using Visual Paradigm Online, a versatile diagramming tool with a large collection of templates. What is a Data Flow Diagram (DFD)? A Data Flow Diagram is a graphical…continue reading →
Beginner’s Guide to Requirement Diagrams in SysML

Beginner’s Guide to Requirement Diagrams in SysML

Introduction SysML (Systems Modeling Language) is a powerful tool for visualizing, specifying, and documenting complex systems. One essential aspect of system modeling is managing requirements effectively. Requirement diagrams in SysML help you capture, organize, and trace system requirements, making it easier to understand and communicate system specifications. In this beginner's guide, we will explore Requirement Diagrams in SysML and how to create them using Visual Paradigm Online with the help of a collection of templates. What is a Requirement Diagram? A Requirement Diagram in SysML is a graphical representation that allows you to…continue reading →
Beginner’s Guide to SSADM DFD Diagrams with Visual Paradigm Online

Beginner’s Guide to SSADM DFD Diagrams with Visual Paradigm Online

Introduction System Structured Analysis and Design Methodology (SSADM) is a widely-used approach for modeling and designing information systems. Data Flow Diagrams (DFDs) are an integral part of SSADM, used to visualize the flow of data within a system. In this beginner's guide, we will introduce you to SSADM DFD Diagrams and show you how to create them using Visual Paradigm Online, leveraging its extensive collection of templates for easy learning through examples. What is a Data Flow Diagram (DFD)? A Data Flow Diagram (DFD) is a graphical representation of how data moves within…continue reading →
Comprehensive Guide to ArchiMate Diagrams

Comprehensive Guide to ArchiMate Diagrams

Introduction ArchiMate is an open and independent enterprise architecture modeling language that provides a standardized way to describe, analyze, and visualize architecture within and across business domains. It is widely used for creating architectural models that help organizations make informed decisions and manage complex systems. This guide will provide you with a comprehensive overview of ArchiMate diagrams, including their purpose, key concepts, and elements, along with practical examples using pre-made templates available in Visual Paradigm Online. Purpose of ArchiMate Diagrams ArchiMate diagrams serve the following key purposes: Architecture Visualization: ArchiMate diagrams help visualize…continue reading →
9 Reasons Why You Should Use Visual Paradigm Online for Diagram Editing

9 Reasons Why You Should Use Visual Paradigm Online for Diagram Editing

In order to visualize complex information and concepts in a simple and intuitive way, diagrams will be what we need. Visual Paradigm Online is a cloud-based diagram tool that provides a wealth of features and functionality for creating and editing diagrams. Here are reasons why you should consider using VP Online for your next project. Collaboration Visual Paradigm Online allows multiple team members to work on the same diagram together in real-time, making it easy to collaborate and stay on the same page. User-friendly Interface Intuitive and user-friendly interface of VP Online makes…continue reading →