


Beginner’s Guide to Deployment Diagrams with Visual Paradigm Online
Introduction
Deployment diagrams are an essential tool in software engineering that allow you to visualize and understand how software components and hardware elements interact within a system. They help you plan the deployment of your software application across different servers, devices, and environments. In this beginner’s guide, we’ll introduce you to deployment diagrams and show you how to create them using Visual Paradigm Online, a user-friendly diagramming tool with a wide range of templates and examples.
What is a Deployment Diagram?
A deployment diagram in software engineering is a type of UML (Unified Modeling Language) diagram that illustrates the physical deployment of software components on hardware nodes. It provides a high-level view of the system architecture, showing how software modules, databases, and other elements are distributed across servers, computers, and devices. Deployment diagrams are crucial for planning, communication, and documentation in software development projects.
Getting Started with Visual Paradigm Online
Before we dive into creating deployment diagrams, let’s get familiar with Visual Paradigm Online:
- Sign Up or Log In: If you haven’t already, sign up for a Visual Paradigm Online account or log in if you already have one.
- Choose a Diagram Type: Once logged in, you’ll see a dashboard. Click on the “+ New Diagram” button to start creating a new diagram. In this guide, we’ll focus on deployment diagrams.
Creating a Deployment Diagram
Visual Paradigm Online offers a wide range of templates and examples to make it easier for you to create deployment diagrams. Here’s how to get started:
- Select a Deployment Diagram Template: In the diagram creation menu, search for “Deployment Diagram” and select a template that suits your needs. These templates are pre-designed with placeholders to help you structure your diagram effectively.
- Adding Nodes: Nodes represent hardware devices or servers in your system. To add a node, simply drag and drop it from the palette onto your diagram. You can customize the properties of each node by double-clicking on it.
- Adding Components: Components represent software modules or applications. To add a component, drag and drop it onto the diagram. Connect components to nodes using deployment connectors to indicate on which hardware they are deployed.
- Associations: Use associations to show the relationships between nodes and components. For example, you can show that a web server node hosts a web application component.
- Artifacts: Artifacts are used to represent files or executable objects deployed on nodes. You can attach artifacts to components to indicate the specific files associated with them.
- Use Stereotypes and Notes: Stereotypes and notes can be added to elements on your diagram to provide additional information or clarify the purpose of each component or node.
- Arrange and Format: Use alignment tools and formatting options to arrange and format your diagram for clarity and readability.
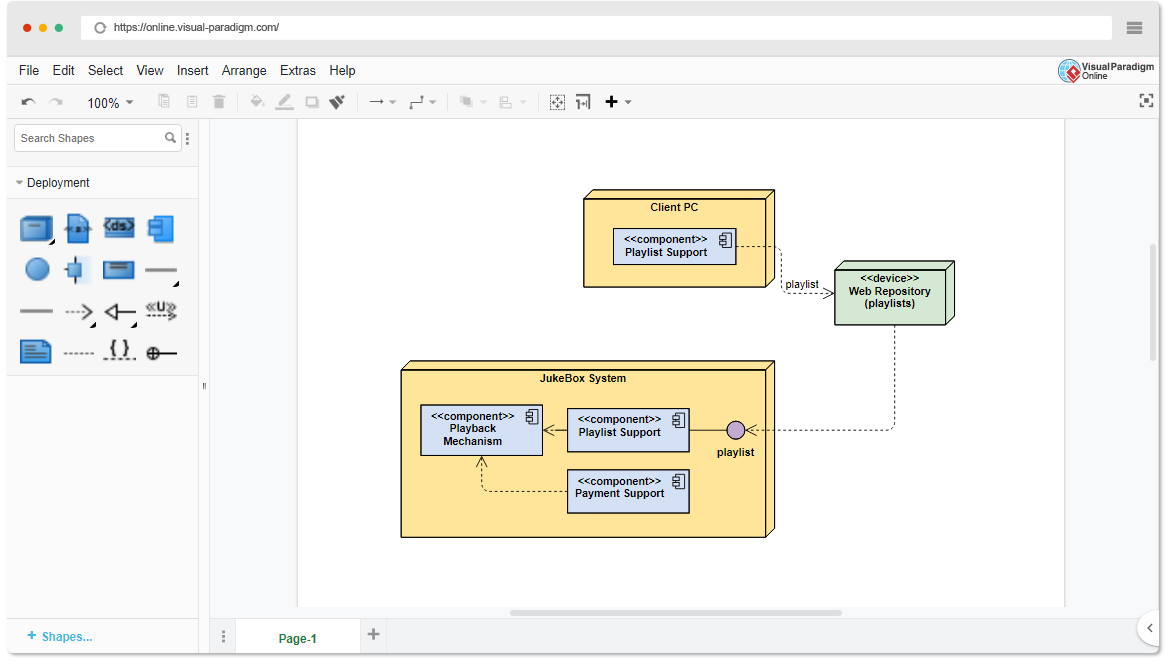
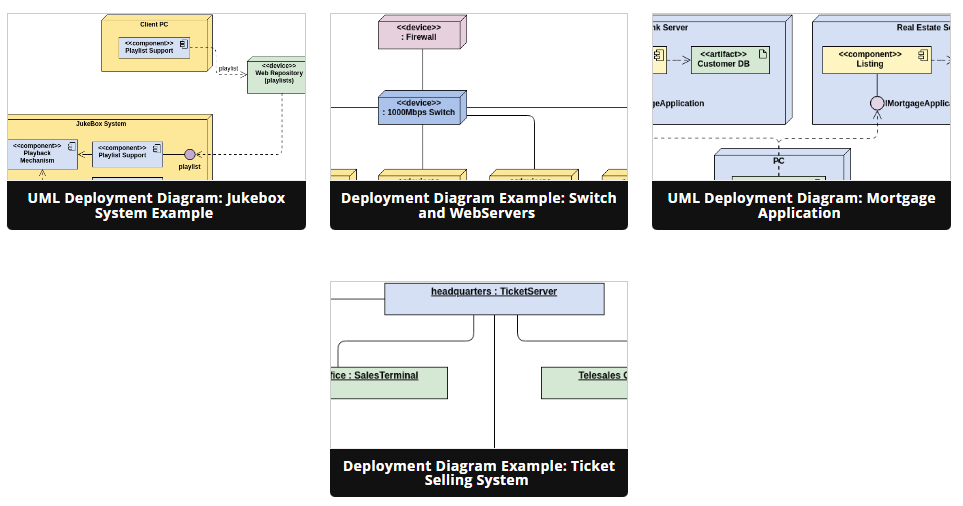
Learning by Examples
Visual Paradigm Online offers a large collection of UML templates and examples to help you learn and create deployment diagrams more effectively. Here’s how to leverage these resources:
- Templates: Visual Paradigm Online provides various templates for different types of systems (e.g., web applications, client-server systems). Start with a relevant template to save time and ensure you’re following best practices.
- Examples: Explore the extensive library of examples available in Visual Paradigm Online. These examples cover a wide range of scenarios, from simple to complex deployments. You can use them as references or modify them to suit your specific project requirements.
- Tutorials and Documentation: Visual Paradigm Online also offers tutorials and documentation to help you understand the principles of deployment diagrams and their best practices. Take advantage of these resources to improve your skills.
Saving and Sharing Your Diagram
Once you’ve created your deployment diagram, make sure to save it. Visual Paradigm Online allows you to save your diagrams in the cloud, making it easy to access and collaborate with team members. You can also export your diagrams in various formats (e.g., PNG, PDF) for sharing or inclusion in project documentation.
Conclusion
Deployment diagrams are valuable tools for visualizing how software components interact with hardware elements in a system. With Visual Paradigm Online’s user-friendly interface, templates, and examples, you can quickly create, learn, and communicate your system’s deployment architecture effectively. Start using deployment diagrams today to improve your software development and system planning processes.
This post is also available in Deutsche, Español, فارسی, Français, English, Bahasa Indonesia, 日本語, Polski, Portuguese, Ру́сский, Việt Nam, 简体中文 and 繁體中文.
