Comprehensive Guide to Causal Loop Diagrams

Comprehensive Guide to Causal Loop Diagrams

Introduction A Causal Loop Diagram (CLD) is a powerful tool for understanding and representing the causal relationships within complex systems. It helps visualize how variables in a system influence each other and whether these influences are positive (reinforcing) or negative (balancing). This comprehensive guide will cover the purpose, key concepts, and elements of CLDs and provide examples using pre-made templates available in Visual Paradigm Online. Purpose of Causal Loop Diagrams Causal Loop Diagrams serve several important purposes: Understanding Complex Systems: They help in gaining a deeper understanding of complex systems by identifying the…continue reading →
Comprehensive Guide to EPC Diagrams

Comprehensive Guide to EPC Diagrams

Introduction Event-driven Process Chain (EPC) diagrams are a powerful tool for modeling, analyzing, and improving business processes. In this comprehensive guide, we will explore the purpose, key concepts, and elements of EPC diagrams. We'll also provide examples using pre-made templates available in Visual Paradigm Online. 1. Introduction to EPC Diagrams Event-driven Process Chain (EPC) diagrams are a type of flowchart used for business process modeling. They were developed within the Architecture of Integrated Information Systems (ARIS) framework in the early 1990s by August-Wilhelm Scheer. EPC diagrams help organizations visualize and document their business…continue reading →
Comprehensive Guide to Value-Stream Mapping

Comprehensive Guide to Value-Stream Mapping

Value-stream mapping (VSM) is a powerful lean management technique used to analyze, optimize, and visualize the flow of materials and information in a specific process or value stream. This comprehensive guide will cover the purpose, key concepts, essential elements, and provide examples using pre-made templates available in Visual Paradigm Online 1. Introduction to Value-Stream Mapping 1.1 Purpose of Value-Stream Mapping The primary purpose of value-stream mapping is to identify and eliminate or reduce waste in a specific process or value stream. This waste reduction aims to increase the efficiency of operations, enhance productivity,…continue reading →
Comprehensive Guide to ArchiMate Diagrams

Comprehensive Guide to ArchiMate Diagrams

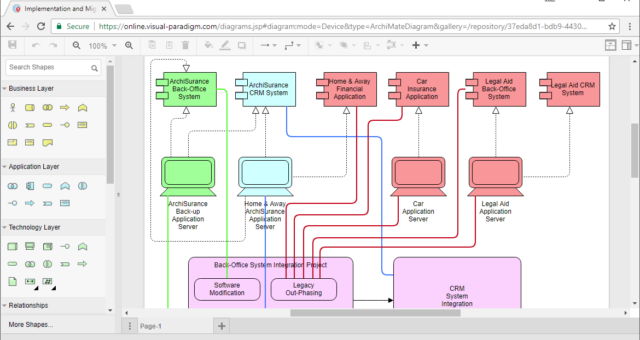
Introduction ArchiMate is an open and independent enterprise architecture modeling language that provides a standardized way to describe, analyze, and visualize architecture within and across business domains. It is widely used for creating architectural models that help organizations make informed decisions and manage complex systems. This guide will provide you with a comprehensive overview of ArchiMate diagrams, including their purpose, key concepts, and elements, along with practical examples using pre-made templates available in Visual Paradigm Online. Purpose of ArchiMate Diagrams ArchiMate diagrams serve the following key purposes: Architecture Visualization: ArchiMate diagrams help visualize…continue reading →
Beginner’s Guide to Hexagonal Architecture Diagram (Data Flow)

Beginner’s Guide to Hexagonal Architecture Diagram (Data Flow)

Introduction Hexagonal Architecture, also known as Ports and Adapters Architecture, is a powerful architectural pattern used in software design. It is designed to create software systems with loosely coupled components that can easily interact with their environment through ports and adapters. This approach promotes flexibility, testability, and maintainability of software systems. In this beginner's guide, we'll introduce you to Hexagonal Architecture through simple explanations and examples, focusing on data flow. Understanding the Basics Origin The Hexagonal Architecture was introduced by Alistair Cockburn in 2005 as a response to common issues in object-oriented software…continue reading →
Beginner’s Guide to SSADM DFD Diagrams with Visual Paradigm Online

Beginner’s Guide to SSADM DFD Diagrams with Visual Paradigm Online

Introduction System Structured Analysis and Design Methodology (SSADM) is a widely-used approach for modeling and designing information systems. Data Flow Diagrams (DFDs) are an integral part of SSADM, used to visualize the flow of data within a system. In this beginner's guide, we will introduce you to SSADM DFD Diagrams and show you how to create them using Visual Paradigm Online, leveraging its extensive collection of templates for easy learning through examples. What is a Data Flow Diagram (DFD)? A Data Flow Diagram (DFD) is a graphical representation of how data moves within…continue reading →
Beginner’s Guide to Yourdon DeMarco DFD Diagrams

Beginner’s Guide to Yourdon DeMarco DFD Diagrams

Introduction Data Flow Diagrams (DFDs) are a valuable tool for visualizing and documenting the flow of data within a system. Yourdon DeMarco DFDs, named after their creators Edward Yourdon and Tom DeMarco, provide a structured way to represent how data moves through a system. In this beginner's guide, we'll introduce you to Yourdon DeMarco DFDs and show you how to create them using Visual Paradigm Online, leveraging its extensive collection of templates. What is a Yourdon DeMarco DFD Diagram? A Yourdon DeMarco DFD Diagram is a graphical representation of how data is processed…continue reading →
Beginner’s Guide to Yourdon and Coad Diagrams with Visual Paradigm Online

Beginner’s Guide to Yourdon and Coad Diagrams with Visual Paradigm Online

Introduction Yourdon and Coad diagrams are a type of visual modeling tool used in software engineering and system design. They help in representing the structure and behavior of a system or software application. In this beginner's guide, we'll introduce you to Yourdon and Coad diagrams and show you how to create them using Visual Paradigm Online, a popular online diagramming tool. What Are Yourdon and Coad Diagrams? Yourdon and Coad diagrams are part of the Structured Systems Analysis and Design Method (SSADM). They are used for modeling and documenting a system's structure, processes,…continue reading →
Beginner’s Guide to Gane-Sarson Data Flow Diagrams

Beginner’s Guide to Gane-Sarson Data Flow Diagrams

Introduction Data flow diagrams (DFDs) are a powerful tool for visualizing and understanding how data moves within a business information system. They help analysts and designers to model processes, data stores, data flows, and external entities in a clear and structured way. Gane-Sarson notation, introduced by Chris Gane and Trish Sarson, is a widely used notation for creating data flow diagrams. In this beginner's guide, we'll introduce you to the basics of Gane-Sarson DFDs and show you how to learn by examples using the extensive collection of templates available in Visual Paradigm Online.…continue reading →
Beginner’s Guide to C4 Model Diagrams

Beginner’s Guide to C4 Model Diagrams

Introduction The C4 model is a powerful graphical notation technique for modeling the architecture of software systems. Developed by software architect Simon Brown, this method provides a clear and concise way to document and communicate software architecture. In this beginner's guide, we'll introduce you to the C4 model and show you how to learn it using the large collection of templates available in Visual Paradigm Online. What is the C4 Model? The C4 model is based on a structural decomposition of a software system into containers and components. It allows you to visualize…continue reading →