Unleashing the Power of Infographics: Create Better Designs with Ease

Unleashing the Power of Infographics: Create Better Designs with Ease

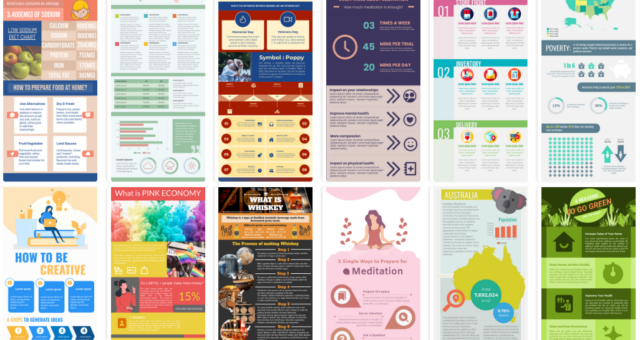
Introduction In today's fast-paced world, where information overload is the norm, visual communication has become more crucial than ever. Infographics, with their blend of text and visuals, have emerged as powerful tools for conveying complex information in a concise and engaging manner. Whether you're looking to illustrate data, explain a process, or simply capture attention, infographics can be your secret weapon. With the right tools and techniques, creating stunning infographics is not just reserved for graphic designers—it's something anyone can achieve. The Importance of Infographics Infographics serve as versatile communication tools, capable of…continue reading →
Visual Paradigm Online: Diagramming Better, Faster, Together

Visual Paradigm Online: Diagramming Better, Faster, Together

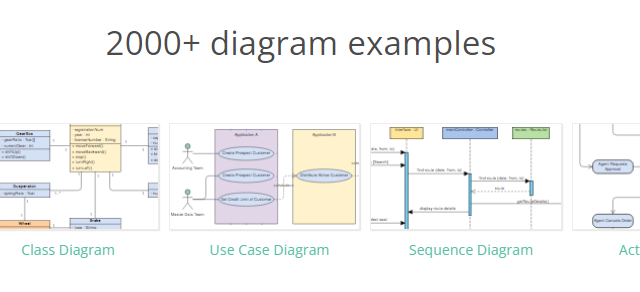
Introduction In the realm of collaborative work, efficient communication is paramount. Visual Paradigm Online (VP Online) emerges as a powerful ally, simplifying diagramming through its robust editor and centralized workspace. Whether you are a web developer, marketing executive, or business analyst, VP Online offers a versatile platform for creating professional diagrams with ease and fostering seamless collaboration. Get Started for Free, Boost Productivity VP Online beckons you with a user-friendly interface and a free entry point for non-profit use. For a mere $9 per user per month, commercial users gain access to a…continue reading →
A Scatter Chart Tutorial: A Quick Guide

A Scatter Chart Tutorial: A Quick Guide

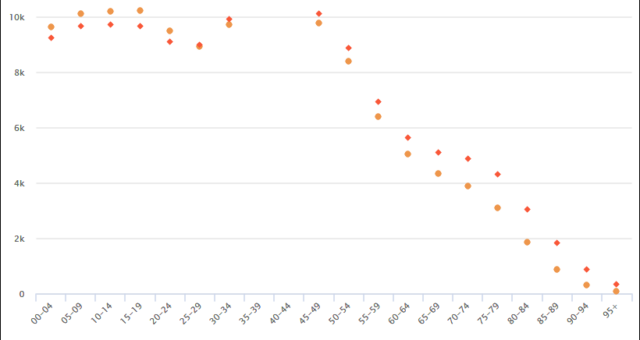
Introduction In the realm of data analysis and visualization, scatter charts serve as invaluable tools for uncovering relationships between variables. In our particular case, we've generated a scatter chart that explores the intriguing connection between arm length and height among a group of Grade 11 students. This visual representation of data, comprised of eight individual data points, allows us to delve into the dynamics between these two attributes. By studying the patterns within the scatter chart, we can begin to make predictions about arm length based on height and height based on arm…continue reading →
Understanding System Context Diagrams in Software Development: A Comprehensive Guide

Understanding System Context Diagrams in Software Development: A Comprehensive Guide

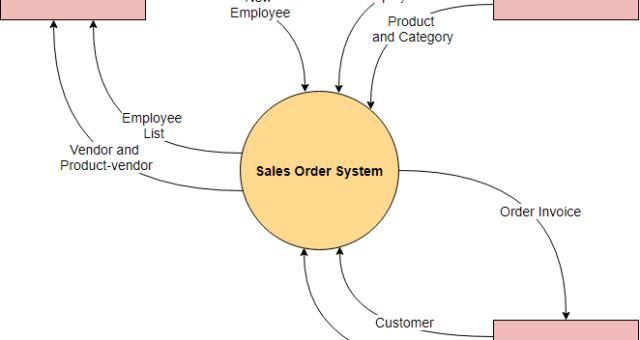
Introduction Understanding System Context Diagrams in Software Development: A Comprehensive Guide In the complex world of software development, effective communication is key. Without a clear understanding of the system's scope and its relationships with external entities, chaos can ensue, leading to misunderstandings, delays, and costly errors. This is where System Context Diagrams (SCDs) come into play. SCDs serve as a foundational tool for visualizing the boundaries and interactions of a software system, helping teams communicate effectively and ensuring everyone is on the same page. What is a System Context Diagram? A System Context…continue reading →
Visual Paradigm Online: Your Ultimate Destination for Effortless Floor Plan Design

Visual Paradigm Online: Your Ultimate Destination for Effortless Floor Plan Design

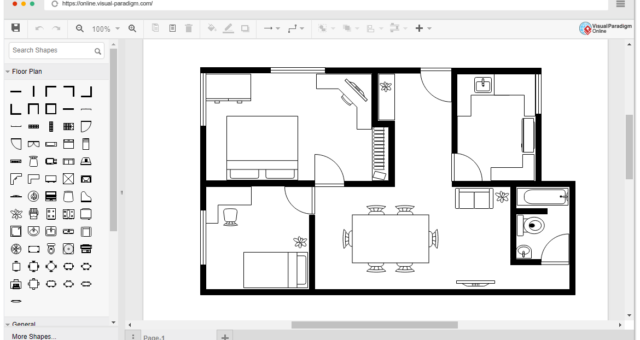
Introduction Designing a floor plan is an integral part of any construction or renovation project, whether it's a small bathroom makeover or a large-scale office design. The precision and clarity of your floor plan can make a significant difference in the successful execution of your project. Enter Visual Paradigm Online, the go-to platform for an easy-to-use online floor plan design tool. With an array of features that cater to both beginners and professionals, Visual Paradigm Online is your one-stop solution for creating high-quality floor plans quickly and effortlessly. Creating Stunning Floor Plans Made…continue reading →
Unveiling the Power of Use Cases: From Identification to Modeling

Unveiling the Power of Use Cases: From Identification to Modeling

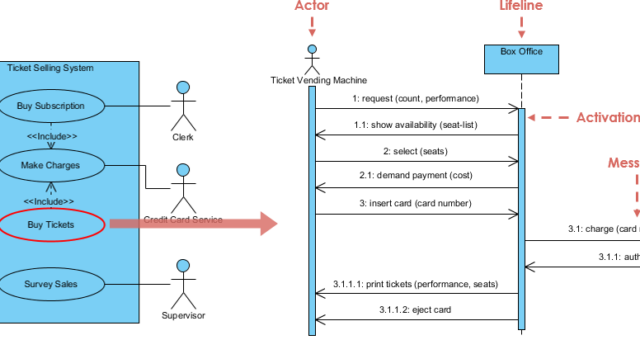
Introduction In the realm of software development and systems analysis, one of the key steps in creating successful applications is the identification and modeling of use cases. A use case is essentially a description of how a system or application behaves in response to a specific user request. These use cases serve as a blueprint for designing and developing systems that meet users' needs efficiently. In this article, we'll delve into the process of identifying use cases, elaborating them using templates, and modeling them through sequence diagrams. Identifying Candidate Use Cases Before diving…continue reading →
Understanding Event-driven Process Chain (EPC) Diagrams: A Comprehensive Guide

Understanding Event-driven Process Chain (EPC) Diagrams: A Comprehensive Guide

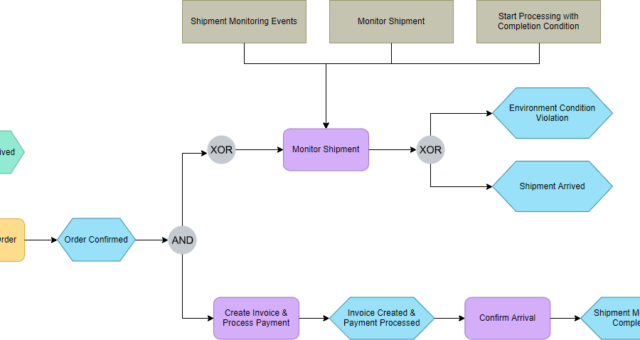
Introduction In the realm of business process modeling and analysis, Event-driven Process Chain diagrams, or EPC diagrams, stand as valuable tools for describing and optimizing workflows. Developed by Professor Scheer and colleagues in Saarland in 1992, these diagrams have since found widespread use in various industries, offering a structured approach to capturing and visualizing complex processes. The Fundamentals of EPC Diagrams At their core, EPC diagrams are graphical representations of business processes. Their main purpose is to connect different perspectives within an organization, particularly emphasizing the command view. These diagrams provide a means…continue reading →
Introduction to C4 Model: a Quick Guide

Introduction to C4 Model: a Quick Guide

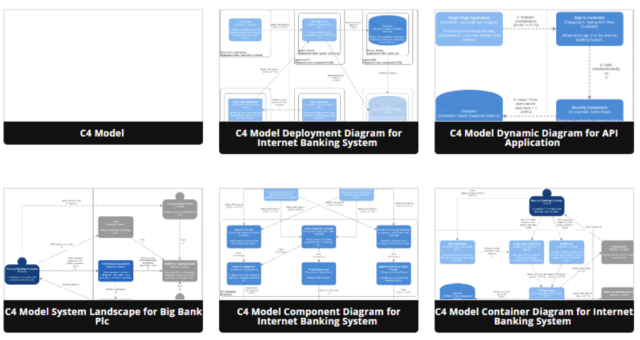
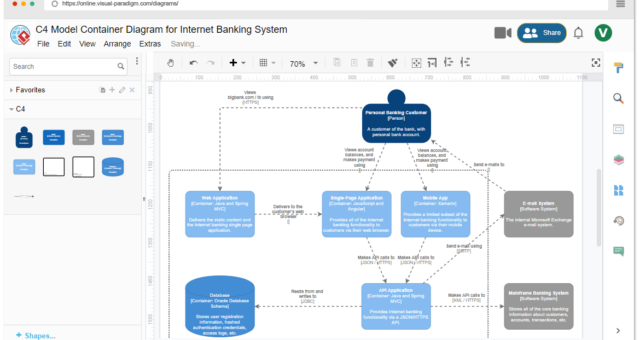
Introduction The C4 model, developed by Simon Brown, offers a structured approach to software architecture diagramming, consisting of four distinct levels that progressively zoom in on the architecture of a software system. Each level provides a unique perspective and serves specific purposes in documenting and communicating software architecture. Let's explore the four levels of the C4 model: 1. System Context Diagram Scope: A single software system. Primary Elements: The software system in scope. Supporting Elements: People (e.g., users, actors, roles, personas) and software systems (external dependencies) directly connected to the software system in…continue reading →
Unveiling the Power of C4 Model: Simplifying Software Architecture Diagrams

Unveiling the Power of C4 Model: Simplifying Software Architecture Diagrams

Introduction In the intricate world of software development, translating complex architectural designs into meaningful and comprehensible diagrams is often a formidable challenge. Effective communication within development teams and with stakeholders hinges on the ability to convey the essence of a system's architecture clearly. Enter the C4 model – a revolutionary approach to software architecture diagramming. In this article, we delve into the depths of the C4 model, its principles, and how it transforms the way we visualize and communicate software architectures. In the realm of software development, conveying complex architectural designs can be…continue reading →
Unlocking Creativity: Exploring Visual Paradigm’s Visual Design Editor Features

Unlocking Creativity: Exploring Visual Paradigm’s Visual Design Editor Features

Introduction Visual design is an integral part of many creative projects, and having the right tools to bring your ideas to life is essential. Visual Paradigm's Visual Design Editor is one such tool that empowers users to create stunning designs with ease and efficiency. Whether you're a professional graphic designer or someone looking to enhance their visual content, Visual Paradigm offers a range of features that can help you achieve your design goals effortlessly. Let's explore some of the key features of Visual Paradigm's Visual Design Editor: 1. Theme: Visual Paradigm understands that…continue reading →