


Visual Paradigm Online: Diagramming Better, Faster, Together
Introduction
In the realm of collaborative work, efficient communication is paramount. Visual Paradigm Online (VP Online) emerges as a powerful ally, simplifying diagramming through its robust editor and centralized workspace. Whether you are a web developer, marketing executive, or business analyst, VP Online offers a versatile platform for creating professional diagrams with ease and fostering seamless collaboration.
Get Started for Free, Boost Productivity
VP Online beckons you with a user-friendly interface and a free entry point for non-profit use. For a mere $9 per user per month, commercial users gain access to a treasure trove of intuitive diagramming tools. These tools empower you to create a diverse range of professional diagrams efficiently. From flowcharts and UML diagrams to mind maps and AWS architecture, VP Online has you covered.
Enable Collaboration, Reduce Cost
The collaborative dimension of VP Online is a game-changer. The cloud workspace ensures that your team’s projects and diagrams are accessible anytime, anywhere. This real-time synchronization of diagram changes in a single workspace is a boon for team productivity. What’s more, the platform is free for non-profit use, making it a cost-effective solution for organizations with charitable missions.
Versatility in Diagramming
Visual Paradigm Online caters to every diagramming need imaginable. With an unlimited capacity to create diagrams, charts, and other visuals, it offers a head start with pre-made templates or the flexibility to create your own. The platform supports a myriad of diagram types, including but not limited to:
- Flowcharts
- UML Diagrams
- Mind Maps
- AWS Architecture
- ArchiMate Diagrams
- Business Process (BPMN)
- Network Diagrams
- and many more…
Huge Collection of Examples and Templates
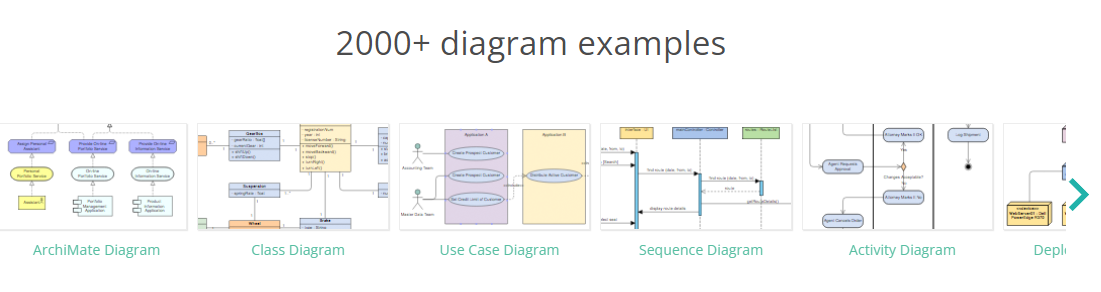
The sheer abundance of diagram examples offered by Visual Paradigm Online is a testament to its commitment to providing users with a comprehensive toolkit for visual communication and problem-solving. With over 2000 diagram examples spanning various categories, industries, and use cases, VP Online empowers users to explore, learn, and implement effective visualizations in their projects. Let’s delve into some of the notable categories and examples:
1. ArchiMate Diagrams: Example: Illustrations of ArchiMate diagrams elucidating enterprise architecture concepts and relationships.
2. UML Diagrams:
- Example: Class diagrams, use case diagrams, sequence diagrams, and more, offering a visual representation of software systems.
3. Business Process (BPMN):
- Example: Detailed business process diagrams using BPMN, aiding in the understanding and optimization of business processes.
4. SWOT Analysis:
- Example: Visual representations of Strengths, Weaknesses, Opportunities, and Threats to facilitate strategic planning.
5. AWS Architecture Diagrams:
- Example: Diagrams showcasing the architecture of applications and systems hosted on Amazon Web Services (AWS).
6. Network Diagrams:
- Example: Visualizations of network topologies, helping in the design and management of computer networks.
7. Mind Map Diagrams:
- Example: Mind maps for brainstorming and organizing thoughts, ideas, and information in a visually intuitive manner.
8. PERT Charts:
- Example: Project Evaluation and Review Technique (PERT) charts for project management and scheduling.
9. Floor Plans:
- Example: Diagrams representing the layout and design of physical spaces, aiding in architectural and interior design.
10. Value Chain Analysis:
- Example: Visualizing the activities that add value to a company’s products or services in the value chain.
11. Azure and Google Cloud Platform Diagrams:
- Example: Visualizing the architecture and components of applications on Microsoft Azure and Google Cloud Platform.
12. Organization Charts:
- Example: Diagrams illustrating the structure of organizations, including hierarchy and reporting relationships.
13. Data Flow Diagrams:
- Example: Representations of the flow of data within a system, aiding in understanding information processes.
14. Five Forces Analysis Diagrams:
- Example: Analyzing competitive forces in an industry using Michael Porter’s Five Forces framework.
15. Entity Relationship Diagrams:
- Example: Visualizing the relationships between entities in a database, crucial for database design.
16. Pest Analysis:
- Example: Diagrams breaking down Political, Economic, Social, and Technological factors for strategic analysis.
17. Rack Diagrams:
- Example: Diagrams illustrating the arrangement of server racks in data centers.
18. Venn Diagrams:
- Example: Overlapping sets represented visually for logical relationships and comparisons.
19. Four Corners Analysis:
- Example: Analyzing different perspectives or options using the Four Corners Analysis method.
20. Customer Journey Maps:
- Example: Visualizing the customer’s interactions and experiences with a product or service over time.
A Visual Playground of Possibilities
Visual Paradigm Online’s extensive library of over 2000 diagram examples transforms it into a visual playground where users can explore, learn, and implement diverse visualizations across various domains. Whether you are a software developer, business analyst, architect, or project manager, VP Online’s rich repository ensures that you find the perfect visual solution for your needs. This wealth of examples not only streamlines the diagramming process but also serves as a valuable educational resource for users looking to enhance their visual communication skills.
Process Map Designer: An Asset for Strategic Planning
The Process Map Designer, equipped with over 40 templates (e.g., Customer Journey Map), is a strategic tool for designing processes, roadmaps, and matrices. This feature enhances the platform’s utility for businesses engaged in complex strategic planning and analysis.
Customer Testimonials: Real Stories of Success
Jeff Gaines, a web developer, commends VP Online for being the best and most easy-to-use online diagram editor. Geraldine Boyd, a marketing executive, hails it as an excellent tool with great performance. Della Copley, a business analyst, expresses appreciation for the customer journey map and strategic analysis toolset.
Flexible Pricing to Suit Your Needs
Visual Paradigm Online understands that different users have different requirements. The pricing plans are tailored to cater to diverse needs:
- Starter: Essential diagramming tools at $4 per user per month.
- Advance: All-in-one diagramming software at $9 per user per month.
- Combo: Complete visual design and diagramming tool at $15 per user per month.
- Free: An intuitive diagramming tool for personal use, free of charge.
Conclusion
Visual Paradigm Online stands out as a comprehensive and user-friendly diagramming tool. It not only simplifies the creation of professional diagrams but also fosters collaboration among team members. With its versatile features, templates, and flexible pricing, VP Online is indeed a visual paradigm for those seeking efficient and collaborative diagramming solutions.
This post is also available in Deutsche, Español, فارسی, Français, English, Bahasa Indonesia, 日本語, Polski, Portuguese, Ру́сский, Việt Nam, 简体中文 and 繁體中文.
