


Understanding Event-driven Process Chain (EPC) Diagrams: A Comprehensive Guide
Introduction
In the realm of business process modeling and analysis, Event-driven Process Chain diagrams, or EPC diagrams, stand as valuable tools for describing and optimizing workflows. Developed by Professor Scheer and colleagues in Saarland in 1992, these diagrams have since found widespread use in various industries, offering a structured approach to capturing and visualizing complex processes.
The Fundamentals of EPC Diagrams
At their core, EPC diagrams are graphical representations of business processes. Their main purpose is to connect different perspectives within an organization, particularly emphasizing the command view. These diagrams provide a means to illustrate how events trigger functions and how various activities interrelate.
EPC diagrams come with a set of connectors that facilitate alternate and parallel execution of processes. These connectors include logical operators such as AND, OR, and XOR, which enhance the diagram’s ability to represent complex relationships and decision points. As such, EPC diagrams are versatile tools for modeling intricate processes.
It’s important to note that EPCs are considered oriented graphs, a concept highlighted in various guidebooks. While there are no strict limitations on constructing EPCs, complex structures with concurrency can lead to poorly-defined operational semantics, posing a challenge for users.
The Use of EPC Diagrams
EPC diagrams serve a multitude of purposes within the business world. They are primarily used to model, analyze, visualize, and modify business processes. Originally, EPC diagrams were closely associated with SAP R/3 modeling when integrated into the ARIS system. However, over time, their applications have expanded beyond this specific context.
The popularity of EPC diagrams can be attributed to their brevity and straightforward notations. They provide a clear and concise representation of processes, making them accessible to a wide range of stakeholders within an organization, from business analysts to process owners.
Understanding EPC Symbols
To effectively work with EPC diagrams, one must understand the symbols used in these diagrams. Here’s an overview of the key EPC symbols:
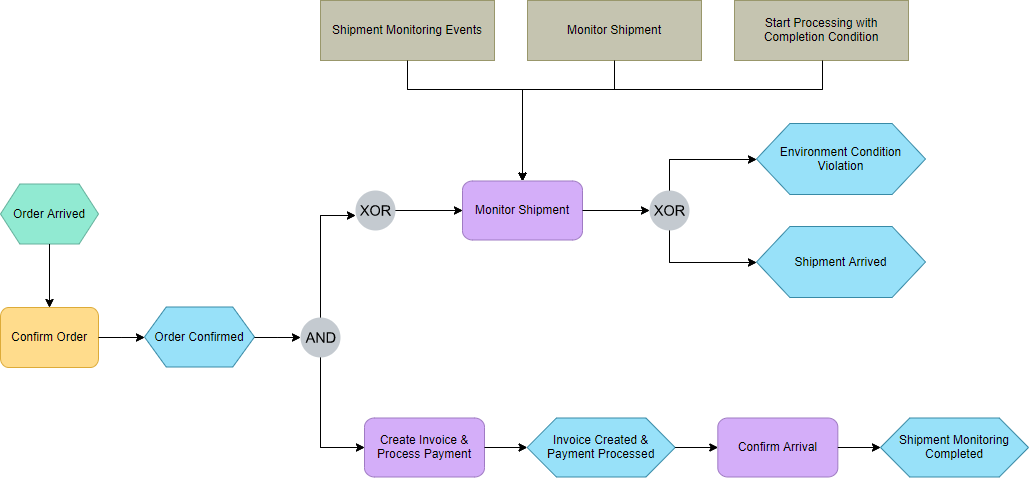
Event-driven Process Chain (EPC) diagrams are widely used in business process modeling to represent complex workflows in a clear and understandable manner. These diagrams employ a set of graphical symbols that help depict the control-flow structure of business processes. Each symbol has a specific meaning and purpose, making EPC diagrams a powerful tool for modeling, analyzing, and optimizing business processes. In this article, we will explore the key symbols used in EPC diagrams and their respective descriptions.
- Event (EPC diagram symbol: event):
- Description: An event in an EPC diagram describes the circumstances under which a function or process operates or the state that a function or process will result in.
- Example: Events can include “Order received,” “Payment approved,” or “Inventory depleted.”
- Symbol: Typically represented as a diamond or hexagon shape.
- Function (EPC diagram symbol: Function):
- Description: A function represents the transformation from an initial state to a resulting state within a business process.
- Example: Functions can include “Process order,” “Generate invoice,” or “Verify customer information.”
- Symbol: Typically represented as a rounded rectangle.
- Operator (EPC diagram symbol: Operators):
- Description: Operators in EPC diagrams are logical connectors that control the flow of the process. They include AND, OR, and XOR operators.
- Examples:
- AND Operator: Activates all paths in the control flow concurrently.
- OR Operator: Activates one or more paths among control flows.
- XOR Operator: Makes a decision on which path to choose among several control flows.
- Symbols: These operators are typically represented as their respective logical symbols.
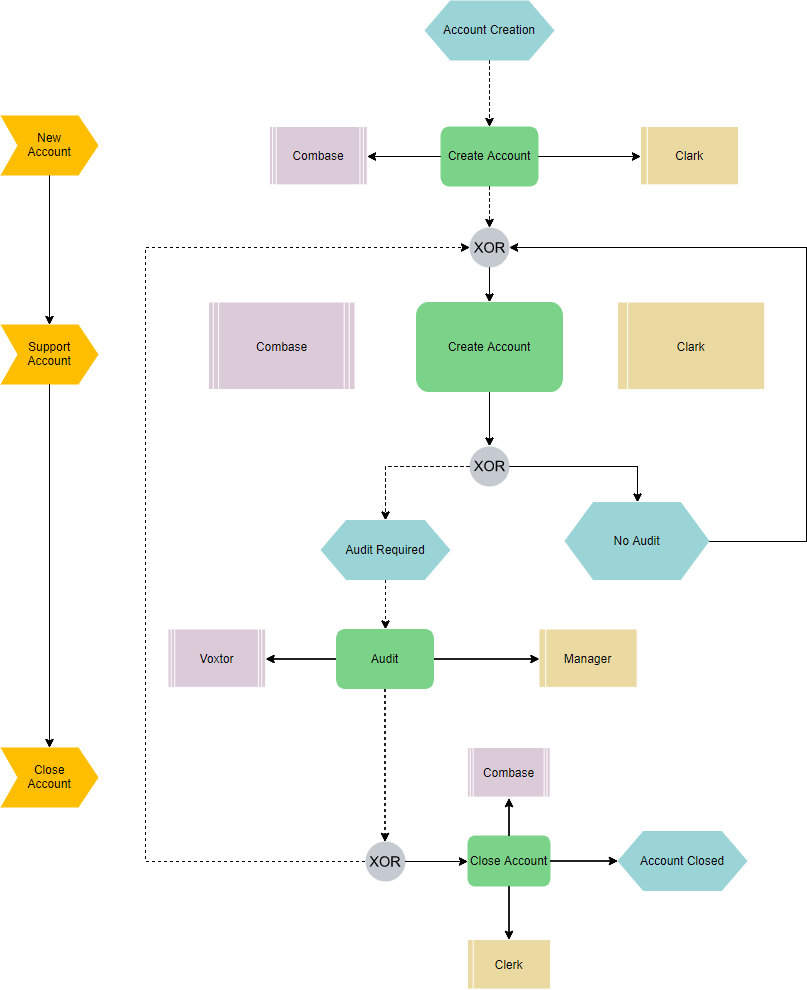
- Organization Unit (EPC diagram symbol: Organization unit):
- Description: An organization unit specifies which person or organization within an enterprise’s structure is responsible for a particular function.
- Example: Organization units can include “Sales Department,” “IT Department,” or “HR Division.”
- Symbol: Typically represented as an ellipse connected by a vertical line.
- Control Flow (EPC diagram symbol: control flow):
- Description: Control flows connect events with functions, process paths, or operators, creating a chronological sequence and logical interdependencies between them.
- Symbol: Typically represented as arrows or lines connecting events and functions.
- Process Path (EPC diagram symbol: Process path):
- Description: A process path illustrates the connection from or to other processes within the diagram, indicating how different processes are related.
- Symbol: Typically represented as lines connecting processes.
- Organization Unit Assignment (EPC diagram symbol: Organization unit assignment):
- Description: An organization unit assignment shows the connection between an organization unit and the specific function it is responsible for, clarifying organizational responsibilities.
- Symbol: Typically represented as a line connecting an organization unit to a function.
- Information Resource (EPC diagram symbol: Information source):
- Description: An information resource represents objects in the real world that can provide input data for a function or receive output data produced by a function.
- Example: Information resources can include “Customer database,” “Inventory system,” or “External data source.”
- Symbol: Typically represented as rectangles within the EPC diagram.
- System (EPC diagram symbol: System):
- Description: A system is depicted as the provider of functions within a process, often representing external systems or entities.
- Example: A system could represent an external payment gateway or an external shipping service.
- Symbol: Typically represented as a rectangle.
- Information Flow (EPC diagram symbol: Information flow):
- Description: Information flows indicate the connection between functions and input or output data, specifying the data upon which the function reads, modifies, or writes.
- Symbol: Typically represented as lines connecting functions and information resources.
Conclusion
Event-driven Process Chain (EPC) diagrams are powerful tools for modeling, analyzing, and optimizing business processes. Their versatility, combined with a well-defined set of symbols and connectors, makes them indispensable in today’s complex business environment. As organizations continue to seek efficiency and process improvement, EPC diagrams remain a valuable asset in their arsenal of process management tools.
Choosing the Right Tool: Unveiling the Best Diagramming Solution for EPC Diagrams
If you’re looking for an online tool to create EPC diagrams, VP Online offers a user-friendly EPC Diagram maker that simplifies the process of creating and designing EPC diagrams. Here are some key features and benefits of using VP Online’s EPC Diagram maker:
- Drag-and-Drop Functionality: VP Online’s EPC Diagram maker is designed for ease of use. It allows you to create EPC diagrams by simply dragging and dropping elements onto the canvas, making the diagram creation process intuitive and efficient.
- Rich Set of Standard Symbols: The tool provides a comprehensive library of standard EPC symbols, ensuring that you have access to all the necessary elements to create any type of EPC diagram. This includes symbols for events, functions, operators, organization units, control flows, process paths, organization unit assignments, information resources, systems, and information flows.
- Online Accessibility: Since it’s an online tool, you can access and use VP Online’s EPC Diagram maker from anywhere with an internet connection. This means you can work on your EPC diagrams whether you’re in the office, at home, or on the go.
- Collaboration: VP Online supports collaboration features, allowing multiple team members to work on the same EPC diagram simultaneously. This is particularly useful for teams working on process modeling and analysis.
- Templates and Examples: The tool may offer templates and examples to help you get started quickly. These templates can be customized to fit your specific needs and serve as a starting point for your EPC diagrams.
- Export and Sharing: You can export your completed EPC diagrams in various formats, such as PDF or image files, and easily share them with colleagues or stakeholders.
- Cloud Storage: Many online diagramming tools offer cloud storage options, which means you can save and access your EPC diagrams securely in the cloud, eliminating the need for local file storage.
To get started with VP Online’s EPC Diagram maker or explore other online diagramming tools, you can visit their website and sign up for an account. Keep in mind that there may be both free and paid subscription options, depending on your specific requirements and usage.
This post is also available in Deutsche, Español, فارسی, Français, English, Bahasa Indonesia, 日本語, Polski, Portuguese, Ру́сский, Việt Nam, 简体中文 and 繁體中文.
