


Unveiling Insights: A Visual Guide to Root Cause Analysis with Visual Paradigm’s 5 Whys Infographic Tool
Introduction
Root cause analysis is a pivotal aspect of problem-solving, and the 5 Whys technique has proven to be an invaluable tool in uncovering the underlying issues behind a problem. In this guide, we’ll explore how Visual Paradigm, a robust diagramming tool, can be employed to create visually engaging and insightful 5 Whys infographics. By seamlessly integrating the power of Visual Paradigm with the systematic approach of the 5 Whys, we aim to provide a comprehensive framework for efficient root cause analysis.
What is 5 Whys Analysis?
The 5 Whys is a powerful technique for problem-solving and root cause analysis. When combined with Visual Paradigm, a versatile diagramming tool, you can create effective infographics to visually represent the 5 Whys analysis. Here’s a comprehensive guide on using Visual Paradigm for creating a 5 Whys infographic:
Step 1: Install Visual Paradigm
Make sure you have Visual Paradigm installed on your system. You can download it from the official website and follow the installation instructions.
Step 2: Open Visual Paradigm
Launch the Visual Paradigm application and create a new project or open an existing one.
Step 3: Select a Diagram Type
Visual Paradigm offers various diagram types. For the 5 Whys, you can choose either a Fishbone Diagram (Ishikawa) or a Cause and Effect Diagram.
- Fishbone Diagram (Ishikawa):
- Go to the “Diagram” menu.
- Select “Fishbone Diagram” or “Ishikawa Diagram.”
- Cause and Effect Diagram:
- Go to the “Diagram” menu.
- Select “Cause and Effect Diagram.”
Step 4: Add the Problem Statement
Identify and add the problem statement at the head of the fishbone or cause-and-effect diagram. This is the issue you are investigating using the 5 Whys.
Step 5: Create Main Categories
For the Fishbone Diagram, these are typically the major categories that could contribute to the problem. For a Cause and Effect Diagram, these are the main branches extending from the problem statement.
Step 6: Ask the First “Why”
Under each main category or branch, add subcategories or sub-branches to represent possible causes. For each subcategory, ask the first “Why.” Why did this happen? Add these as child elements.
Step 7: Repeat the Process
For each answer to the first “Why,” continue asking “Why” and adding subcategories. Repeat this process until you reach the root causes of the problem.
Step 8: Customize and Format
Enhance the visual appeal of your infographic by customizing colors, shapes, and text styles. Visual Paradigm provides a range of formatting options.
Step 9: Add Details
Include additional information, such as data, evidence, or notes, to support each cause. This helps in a more comprehensive understanding of the problem.
Step 10: Save and Share
Once your 5 Whys infographic is complete, save your project and export the diagram in a preferred format (e.g., image or PDF). You can share it with your team or stakeholders for further analysis or decision-making.
Tips:
- Use clear and concise language in your diagram.
- Encourage collaboration by sharing the Visual Paradigm project file with team members.
By following these steps, you can leverage Visual Paradigm to create a visually appealing and informative 5 Whys infographic for effective root cause analysis.
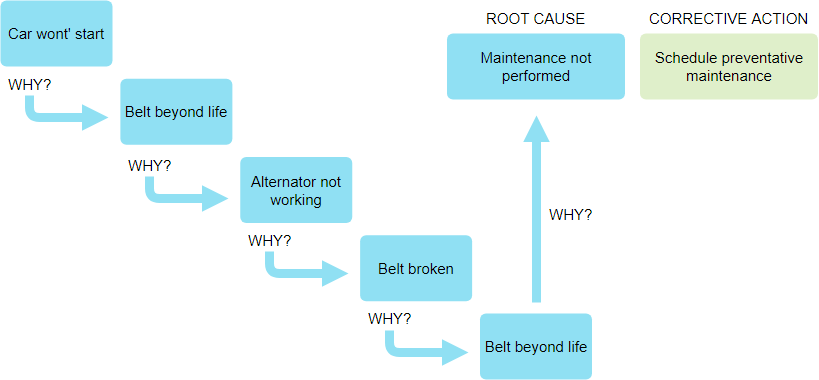
5 WHYS Root Cause Analysis Example – Car Won’t Start
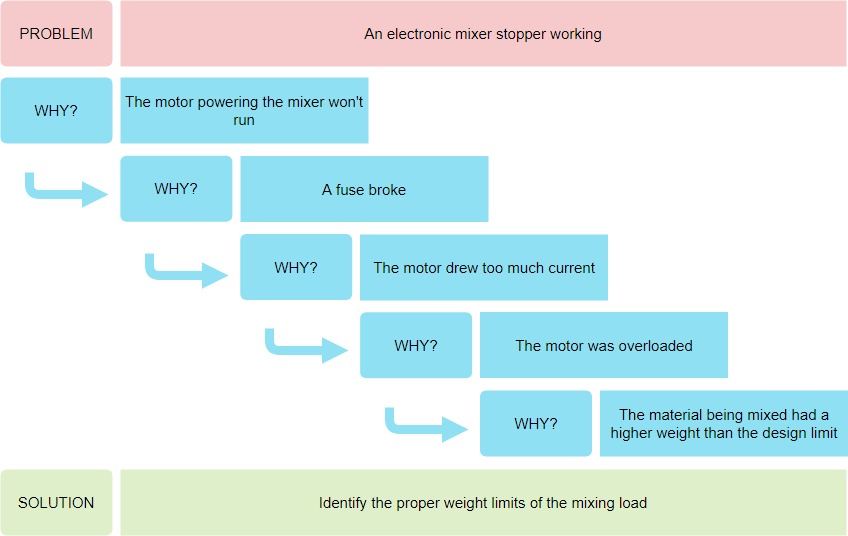
5 Whys Root Cause Analysis Example – An electronic Mixer Stopped Working
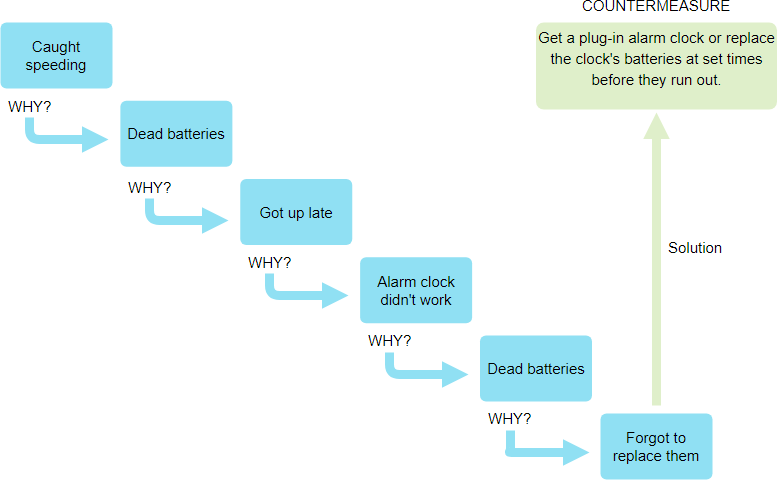
5 Whys Root Cause Analysis Example – Caught Speeding
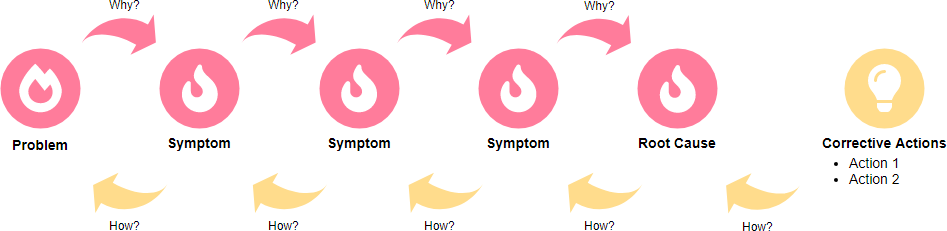
By repeatedly asking the question, “Why?”, you can peel away the layers of an issue and get to the root cause of a problem. Keep asking “Why?” until you reach an actionable level.


")
Summary
This guide walks you through the process of utilizing Visual Paradigm to construct a 5 Whys infographic, fostering a deeper understanding of the issues at hand. From the installation of Visual Paradigm to the customization of your infographic, each step is carefully outlined to ensure a seamless and effective root cause analysis. Whether you choose the Fishbone Diagram or the Cause and Effect Diagram, Visual Paradigm offers a user-friendly interface for visually representing the interconnected causes of a problem. Elevate your problem-solving capabilities by combining the analytical prowess of the 5 Whys with the visual prowess of Visual Paradigm.
This post is also available in Deutsche, Español, فارسی, Français, English, Bahasa Indonesia, 日本語, Polski, Portuguese, Ру́сский, Việt Nam, 简体中文 and 繁體中文.
