


Create a range area chart
A range area chart type of data visualization is primarily used to display both high and low values for a given time period. The x-axis usually represents the time scale to show how the data changes over time. This video will show you how to create a range area chart in Visual Paradigm Online.
What is a range area chart?
A range area chart displays information as a range of data by plotting two Y values (low and high) for each data point. It looks like two lines, and the area between them is usually filled with a color or pattern. A range area chart is similar to an area chart. The main difference between the two chart types is that in a range area chart, colors fill the area between low and high values.

Range Area Chart Advantages & Disadvantages
Advantages
- A useful tool for comparing two or more quantities.
- Data is easy to follow and understand.
- Great for showing trends over time and analyzing statistics.
Disadvantages
- It’s easy to track and understand trends, but it’s impossible to compare exact values.
- Not valid when comparing large amounts of data. Data graphs are overlapping and it can be difficult to determine where they end or begin.
How to create a range area chart?
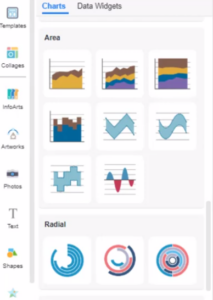
- In VP Online, you can create a range area chart by selecting the Charts tool, then drag out the range area chart into your design.
- You can go to Format Panel_ Chart_ Edit data_ to alter the data of the chart in a spreadsheet. Easily edit your data in an intuitive spreadsheet editor. Visual Paradigm Online makes it simple to enter your information and turn it into a stunning chart.
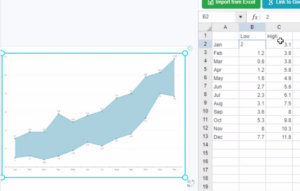
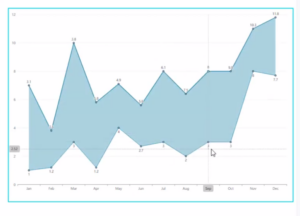
- You can also alter the chart data by directly drag & drop the range in the chart.
- You can change the chart style in the Format panel. Visual Paradigm Online supports a rich set of style options for all chart types. You can easily customize your chart to match your company’s brand colors and fonts or choose the color that matches your topic. Customize everything, from the fonts and colors to the position of titles and legends in a few clicks.
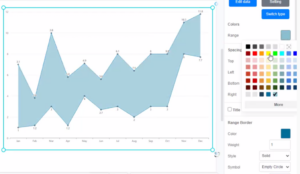
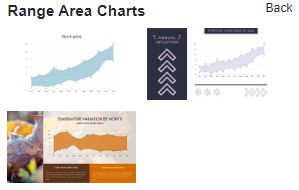
Chart Templates
Visual Paradigm Online free chart maker features a wide range of professional chart templates. You just need to select a template to get started, and then enter your data to get instant results. Try to choose a beautiful template that you want, and easily create your own range area chart.
This post is also available in Deutsche, Español, فارسی, Français, English, Bahasa Indonesia, 日本語, Polski, Portuguese, Ру́сский, Việt Nam, 简体中文 and 繁體中文.
