


Create A Semi-Doughnut Chart
The semi-circle chart generally uses half (or more than half) circles, which has the same function as the ordinary circle chart, except that the percentage is displayed in the form of a semi-circle, which is sometimes more in line with the vision. This video will show you how to create a semi-doughnut chart in Visual Paradigm Online.
What is a Semi-Doughnut Chart?
A Semi-Doughnut Chart is a 180 degrees graph that represents a composition as a whole. The semi-circle chart generally uses half (or more than half) circles, which has the same function as the ordinary circle chart. You can create a semi-doughnut chart if your data range has a total. When a total is in your data range, the semi-doughnut chart will be the total, and the other parts will contain the other data series.

Semi-Doughnut Chart Advantages & Disadvantages
Advantages
- Display the percentage in the form of a semi-circle chart, which is intuitive and novel
- In some specific cases, a semi-circle chart can be very effective in displaying information.
- When the proportion of the sector reaches 25% or 50% of the parent, the semi-circle chart can well achieve the purpose of display
Disadvantages
- It is difficult to compare different sizes in a semi-circle chart or to compare data between different semi-circle charts.
How To Create A Semi-Doughnut Chart?
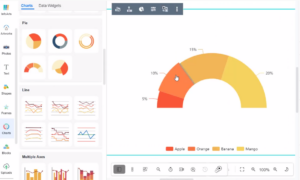
- In VP Online, you can create a semi-doughnut chart by selecting the Charts tool, then drag out the semi-doughnut chart into your design.
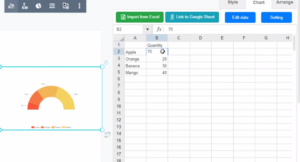
- You can go to Format Panel_ Chart_ Edit data_ to alter the data of the chart in a spreadsheet. Easily edit your data in an intuitive spreadsheet editor. Visual Paradigm Online makes it simple to enter your information and turn it into a stunning chart.
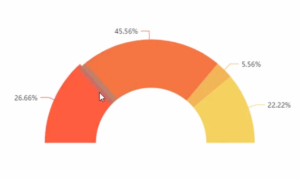
- You can also alter the chart data by directly dragging _amp_ drop the sector in the chart.
The color of the sector can be adjusted under the Colors section of the format panel. You can change the chart style in the Format panel. Visual Paradigm Online supports a rich set of style options for all chart types. You can easily customize your chart to match your company’s brand colors and fonts or choose the color that matches your topic. Customize everything, from the fonts and colors to the position of titles and legends in a few clicks.
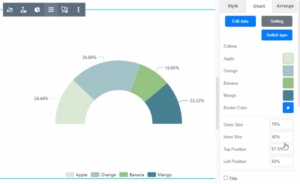
Chart Templates
Visual Paradigm Online free chart maker features a wide range of professional chart templates. You just need to select a template to get started, and then enter your data to get instant results. Try to choose a beautiful template that you want, and easily create your own semi-doughnut chart.
This post is also available in Deutsche, Español, فارسی, Français, English, Bahasa Indonesia, 日本語, Polski, Portuguese, Ру́сский, Việt Nam, 简体中文 and 繁體中文.
