


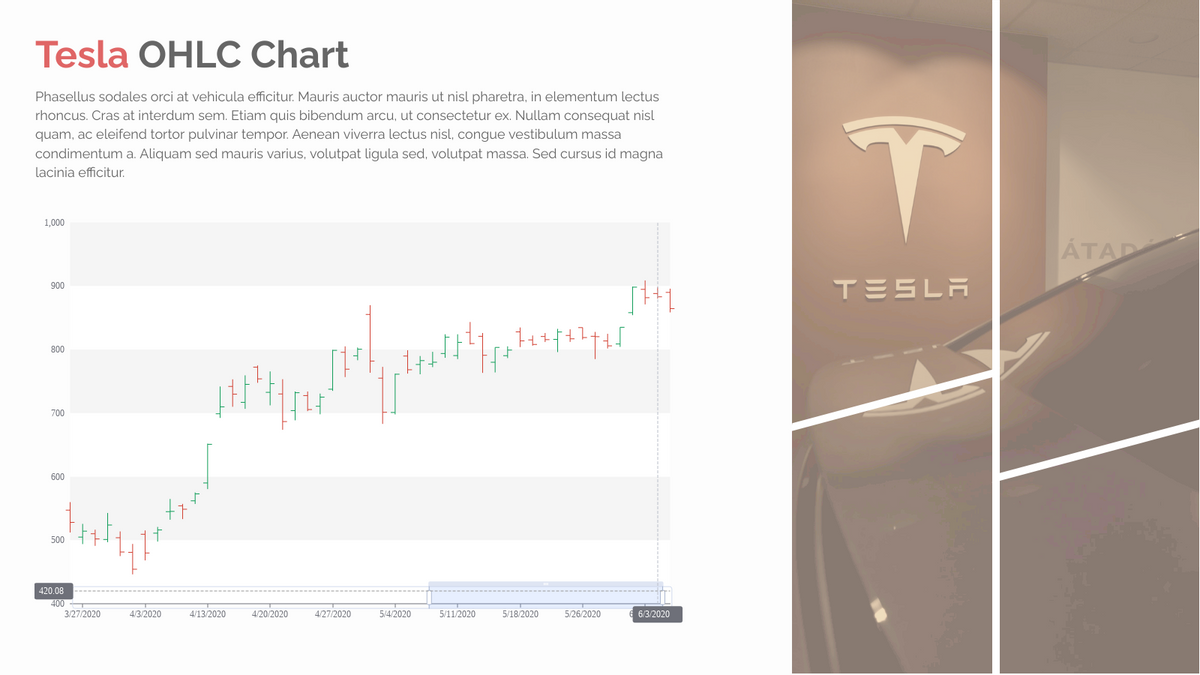
How to create a OHLC chart?
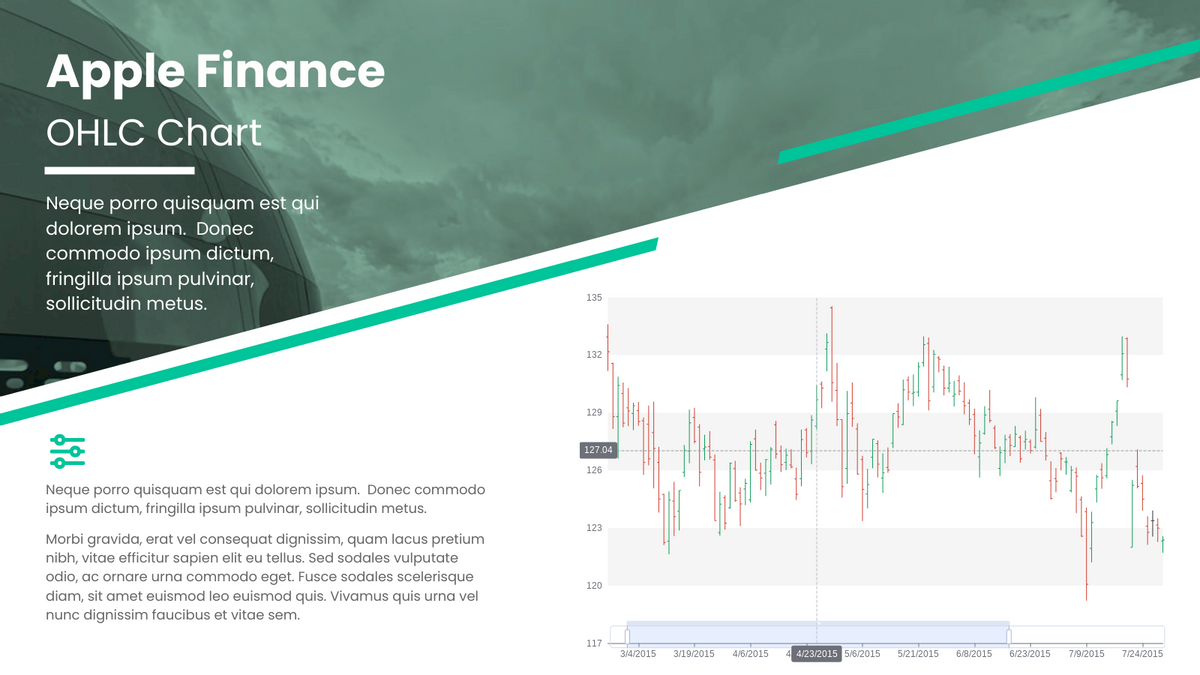
OHLC charts are bar charts that show the open, high, low and close prices for each period. They are used in indicating the four most important data points for each period. In this video, you can see how to create OHLC chart in VP Online.
The steps are as follow;
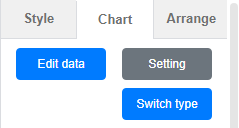
- Click chart and select the OHLC chart

- Drag the chart into your canva
- Select edit data from the chart panel
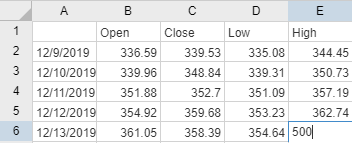
- Replace the data template with your own data
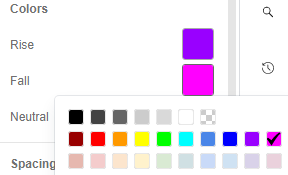
- Upon completion you can edit you chart style (color/font/font size)
Would you like to creation your own OHLC chart now? It is easy to do so in online visual paradigm. Here is some sample you can try out!!!
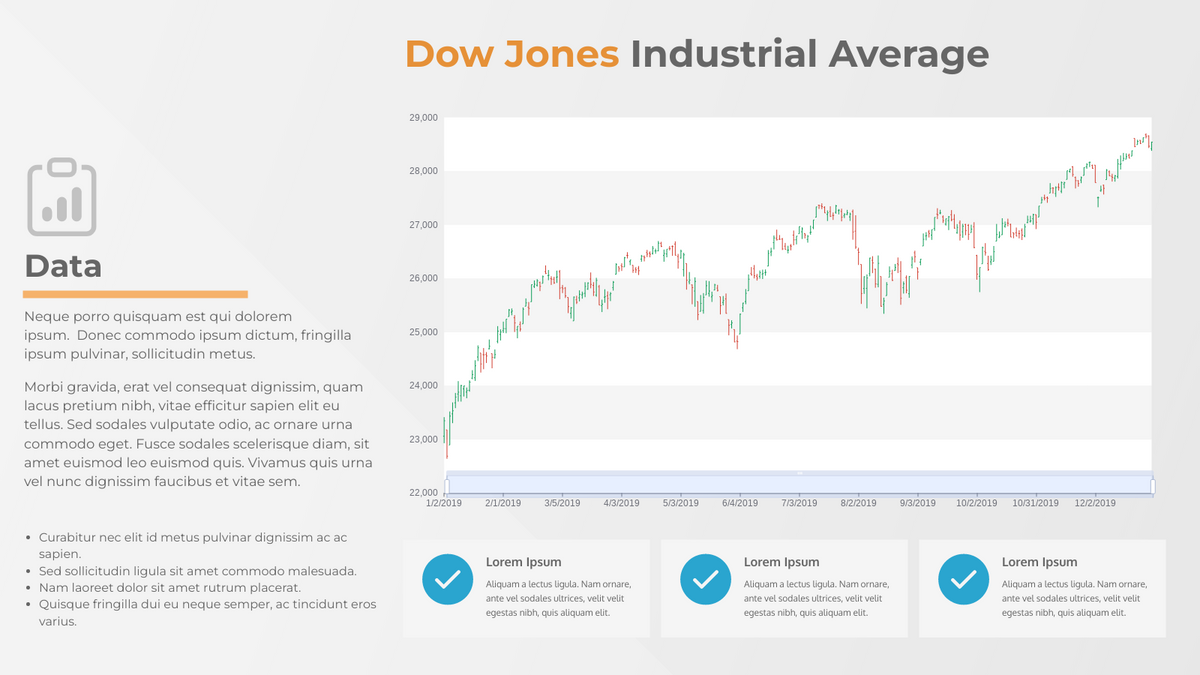
Dow Jones Industrial Average OHLC Chart
This post is also available in Deutsche, Español, فارسی, Français, English, Bahasa Indonesia, 日本語, Polski, Portuguese, Ру́сский, Việt Nam, 简体中文 and 繁體中文.
