


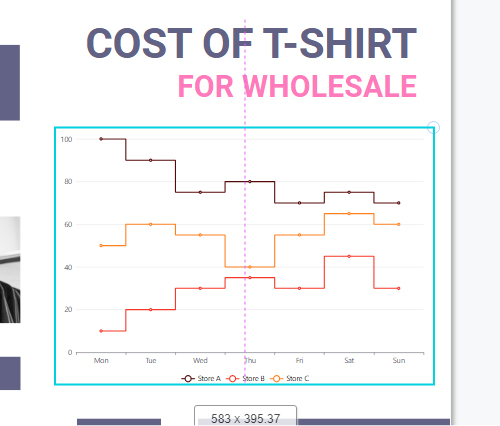
How to Create a Step Chart
A step chart can be useful if you have to display the data that changes at irregular intervals and remains constant between the changes. A step chart can be used to show changes in commodity prices, changes in tax rates, changes in interest rates, etc. Create charts easily with Visual Paradigm Online. In this video, you can see how to create a stepped chart in VP Online.
The steps are as follow:
- Select the step chart from the chart panel under the line tab

- Drag in the chart to canvas and adjust the size
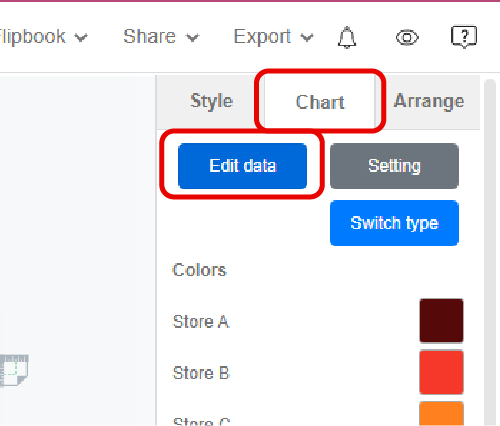
- Click “edit data” under the chart tab from the right panel
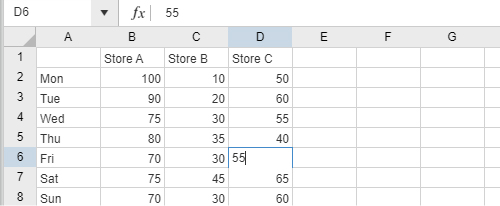
- Replace the old data with new data
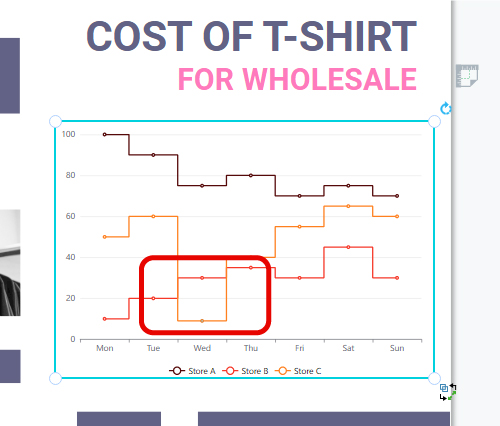
- Adjust the step chart by dragging the line as you like
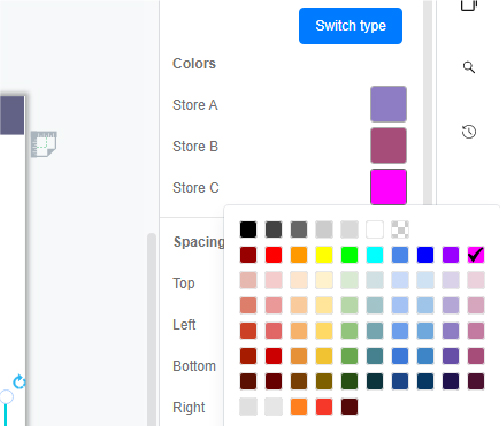
- Change the color of the lines by clicking on the color tabs
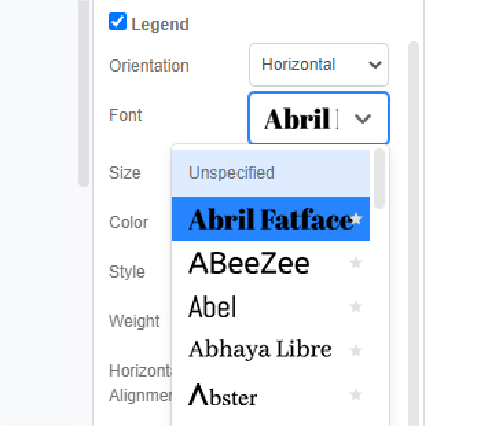
- Apart from the chart color, you can also adjust the font size on the axis
This post is also available in Deutsche, Español, فارسی, Français, English, Bahasa Indonesia, 日本語, Polski, Portuguese, Ру́сский, Việt Nam, 简体中文 and 繁體中文.
