


How to switch chart type?
In Visual Paradigm Online, you can design your own charts with our online design tool. We often record data and sometimes we may need to present the data through graphics. With Visual Paradigm Online design tool, you can create various charts freely like bar charts, column charts, pie charts, etc. This chart tool can help you to display any data by using text, symbols, and graphics. You can easily visualize the data that you have collected as graphics and they are presentable. This is a guide for teaching you to switch chart types. You can watch the attached video or read through the guide below.
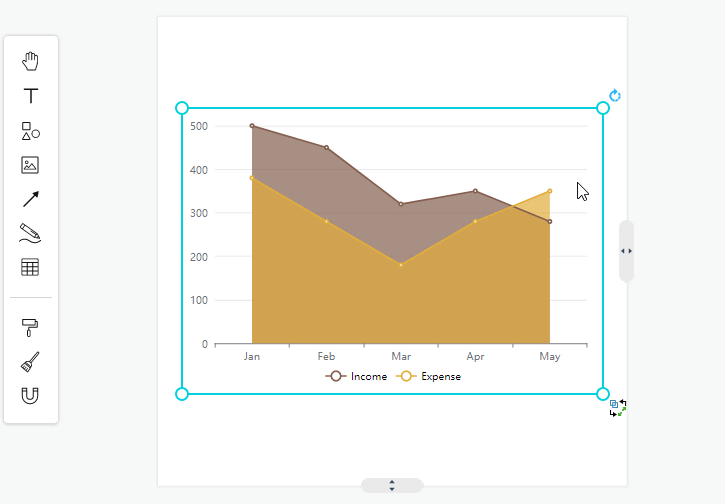
Click on a chart
For switching chart types, you can first select the chart you have designed on the canvas in Visual Paradigm Online editor. You can simply click on the chart that you would like to switch.
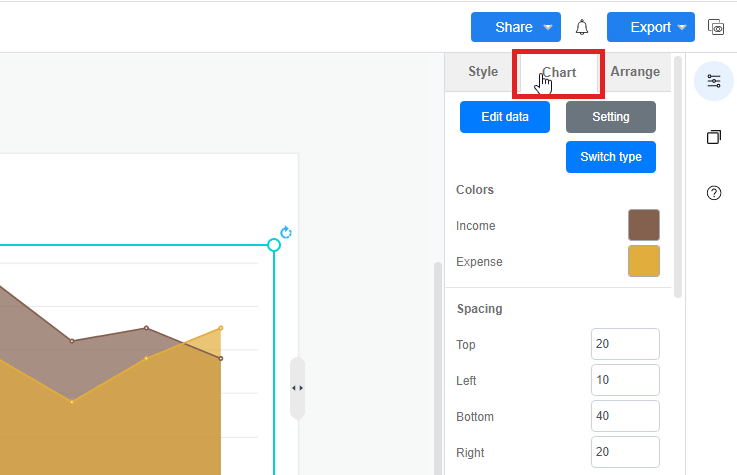
Select Switch type
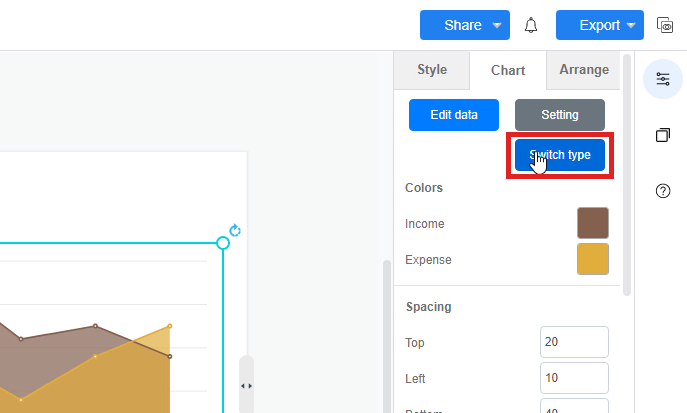
After selected a chart on the canvas, you can go to format panel, which is on the right hand side of the page. You can click on “Chart” on the upper part of the format panel. Then you can select the button of “Switch type” on the panel. It is in blue color. After the selection, various of chart types icons will be appeared automatically on the format panel.
Click on a chart icon
After clicking the “Switch type” icon, you can now select a chart for switching types on the list of icons. You can freely select any types of charts based on the icons of different chart type. By selecting the chart with one click, your designed chart type will be switched from originally chart type to the one you recently selected on the format panel automatically. It is a fast way for user to change their chart type with just a click without changing the imputed data.

This post is also available in Deutsche, Español, فارسی, Français, English, Bahasa Indonesia, 日本語, Polski, Portuguese, Ру́сский, Việt Nam, 简体中文 and 繁體中文.
