


ArchiMate examples
In this article, you will see a rich collection of ArchiMate examples views, organized into a layered framework following the ArchiMate standard. These ArchiMate views demonstrate how ArchiMate elements can be used. Some of the examples can be used as design patterns.
The examples are designed with Visual Paradigm Online, based on the examples in the ArchiMate Cookbook. If you have not yet checked out the cookbook, recommend you take a look. Link: http://www.hosiaisluoma.fi/ArchiMate-Cookbook.pdf
ArchiMate Example Views
Framework View
This Framework view structures all the views being used. It can be used for navigation between diagrams.
Motivation Views
This motivation view can be used to examine the motivations, or causes, that drive an organization’s design or transformation, as well as its enterprise architecture, which serves as the foundation for all change operations and business transformations within a company. This view depicts the development effort’s vision, whether the scale and scope encompass the entire organization, a subset of it (e.g., a line of business), or a particular program or project (solution level). Note that a value can be added to any ArchiMate element, such as the outcome (or any other ArchiMate element), to show what the real value add is.
The Business Motivation Model (BMM) [specification v.1.3, 2015, OMG] is used to define the motivational elements.
Mission-Values-Vision View

The purpose, vision, and basic values of the organization can all be represented using the Mission-Values-Vision view. It helps you identify an organization’s purpose, what is the organization actually doing or intends to do, and what is the primary reason for its existence. The vision is the desired state of the organization in the future. The vision, the culture, and the ideals of the organization are all supported by core values. Strategic goals must be met in order for the organization’s vision to be realized.
Reference: Aldea, A. – Iacob, M.-E. – Hillegersberg, J. – Quartel, D. – Franken, H. (2015) Modelling strategy with ArchiMate.
Strategic Value Map View

The Strategic Value Map view visualizes an organization’s strategies. All development operations must be drawn – directly or indirectly – from this view, which comprises strategic value-elements. It is feasible to track all of the other aspects associated with the actual strategy execution by visualizing the strategic values. The approach can be represented, conveyed, and related to reality with this perspective.
Stakeholder Analysis View

The Stakeholder Analysis view is frequently used for stakeholder analysis to identify the change drivers. First, identify the important stakeholders, then the change drivers that are in their best interests. The “Assessment” concepts can be used for in-depth driver analysis, such as using the SWOT (Strengths, Weaknesses, Opportunities, and Threats) technique. Different stakeholder view diagrams can be generated from various viewpoints, as is customary. Another reason for breaking up huge diagrams into smaller ones is to keep them compact and readable — for the purpose of clarity.
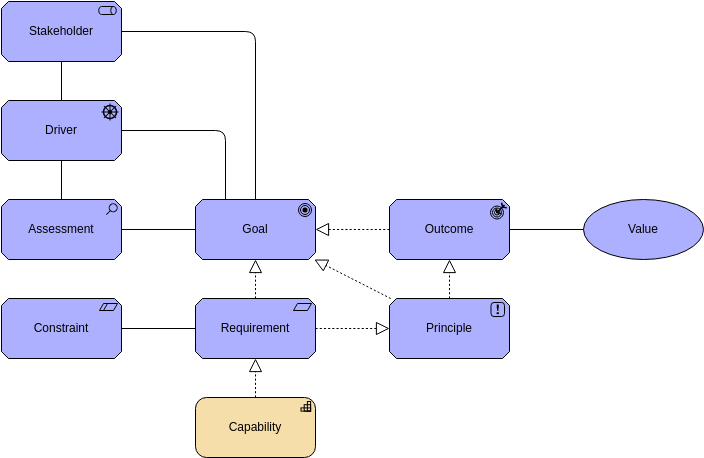
Stakeholder View

This Stakeholder view connects stakeholder motivations to corporate objectives. Goals are the most important component of an organization’s development. Any subsequent elements for all change actions should be traced back to these primary reasons.
Principles View

Risk & Security View

Risk and Security concepts are mapped to the ArchiMate through this view. Risk management includes concerns about security and data protection. Both are covered by this view.
References:
- How to Model Enterprise Risk Management and Security with the ArchiMate® Language, Open Group, DocumentNo: W172, 2017.
- Modeling Enterprise Risk Management and Security with the ArchiMate® Language, Open Group, 2015.
SWOT Analysis View

Goals View

Objectives and Key Results

OKR, short for Objectives and Key Results, is a popular management method for defining goals and tracking progress. It aids in the creation of alignment and engagement around measurable objectives. OKRs are made up of two parts: (1) the goal you wish to attain and (2) the key results that will be used to track your progress toward that goal.
Objectives are…
- Qualitative explanations of what you want to accomplish that are memorable. Short, inspiring, and engaging objectives are ideal. The team should be motivated and challenged by the goal.
Key results are…
- Set of measures that track your progress toward achieving your goal. You should have two to five key results for each target. Having too many key results will make it hard for people to remember.
Another version with actions shown below.

Strategy Views

Strategy View
Business strategy-related concepts such as “Course of Action,” “Capability,” and “Resource” are now available in ArchiMate version 3, and can be used to model an organization’s business plans. The usefulness and significance of this view lies in the manner that the organization’s goals can be linked to strategies and then to enterprise architecture via capabilities. This view can be used to apply the “Goal-Based Strategic Model” (Azevedo et al. 2015), in which goals form a hierarchy that can be dissected into lower-level goals.
Business Strategy View

Business Motivation Model (BMM) View
 View")
Requirements View

This Requirements view can be used to collect needs based on strategic objectives. This is the process of connecting strategies to implementations: strategies can be traced all the way to execution.
Strategy to Capability View

The Strategy to Capability view, along with other ArchiMate elements like “Driver” and “Goal,” can be utilized for Capability-Based Planning (CBP), as shown in the ArchiMate diagram below. This view can be used to aid in the planning (and execution) of strategies. As a result, this type of perspective can be employed in the Strategy-to-Capability phase, which is part of IT4IT’s “Strategy-to-Portfolio” phase.
Capability Map View

The Capability Map view can be used to give a high-level overview of a company’s capabilities: what it does or can do.
Capability Planning View

The Capability Planning view can be utilized for “the Link between Strategy and Enterprise Architecture,” as defined by Capability-Based Planning (CBP). This approach can be used to map strategies to required capabilities and capabilities to resources and other building blocks, among other things.
Capability Realization View

Capability Realization View 2

Another example of the Capability Realization view that shows how to define which elements can be used to realize a capability.
Value Stream View

It is important to note that at the beginning of a value chain / value stream, a “directed association” is used. Value “stages” can be found in a value stream. A “value chain,” which is made up of value streams, can be analogous to an overarching, high-level value stream. The IT4IT (link) introduces a value chain that includes four value streams: Strategy to Portfolio, Requirement to Deploy, Request to Fulfill, and Detect to Correct (link).
Value Stream – Capability Cross Mapping View

A simple example of a Value Delivery Chain is shown below. The ArchiMate Value Stream element, which is featured in the ArchiMate 3.1 edition, can be used to model Value Chains, Value Networks, and Value Streams.
This is a more detailed example of how capabilities assist (serve) the value stream. This perspective can be used to define WHAT the company does (the Business Model) and WHY capabilities are required, as well as their relationship to value creation.
The reference implementation of the Lean EA Framework (LEAF) includes this view (link). Go to “Value Streams” and then “Value Delivery Chain.”
Business Model Canvas View

This is a basic version of A. Osterwalder’s Business Model Canvas (BMC), and it can be tweaked to fit your needs. Versioned techniques such as “Service Model Canvas” and “Lean Canvas” are also available. A BMC can be used to design and innovate business models, for example.
“Facilitates tracing of requirements from business requests down to design specifications” by modeling a BMC with ArchiMate. This aids in the discovery of the consequences of changes in business models on architectural design.” [L.O. Meertens and colleagues]
Built-in architecture assistance for strategy and business model analysis is included in holistic development. This allows business analysts and developers to assess how well the business model supports the strategy and fits within the organization, as well as vice versa.
When the BMC is modeled in a modeling tool, one benefit of this method is that all of the BMC’s elements can be reused in other views of the same model repository. When pivoting the business model, all of the changes are obvious right away. Business modelers can construct new elements, such as services, or use all of the repository’s existing elements, such as organizational units and resources.
Concept Canvas View

The BMC can come in a variety of forms, as shown above. The layered approach of ArchiMate is reflected in the layout of this Concept Canvas.
Business Views
Business Architecture Layer Views.
There are various “maps” of elements controlled within the EA-tool in each layer, such as Business Services Map, Process Map, and so on. After you’ve recognized and introduced maps, you can use them in other diagrams (such as layered views). The maps’ goal is to handle “EA assets” catalogs as “portfolios” (analogous to portfolios of ideas, services and projects etc.). Other features, like as properties or attributes, are often provided by EA-tools for each element. These can be used to provide further details on each aspect. This type of additional data can also be used for various types of analysis.
Each layer can have multiple maps, such as the following:
- Business Services, Business Actors, and Business Processes in the Business Layer;
- Application Services, Applications in the Application Layer;
- Technology Services, Platforms, and Technologies in the Technology Layer; and so on.
Here are some examples of business layer maps.
Business Services Map View

The Business Services Map view provides an overview of the company’s business services. For management purposes, this type of view can be utilized as a “Service Catalog” or “Service Portfolio.” It’s critical to figure out what kind of commercial services the company offers to its clients. A business service can also be used to simulate all of the underlying organizational processes and structures. As a result, business services are critical components of the corporate architecture.
Business Process Map View

This view can be used as a “Process Map,” which provides an overview of the organization’s business processes.
Business Process Co-Operation View

This view can be used to model the operational model, for example.
Business Actors Map View

There are two kinds of business actions: Internal and external. Customers, business partners, or other stakeholder groups that collaborate with the organization are examples of internal business actors, while external business actors are customers, business partners, or other stakeholder groups that collaborate with the company (such as public sector organizations or other governance authorities).
Business Actor Co-Operation View

The following are two usage scenarios:
- Intra-Enterprise View: This view visualizes how internal business actors collaborate and share information.
- Inter-Enterprise View: An ecosystem view that portrays the operational environment in which an organization functions. An ecosystem is a collection of organizations and commercial partners that collaborate through interactions. There are suppliers, subcontractors, and other business-to-business partners, as well as customers.
Business Process View

The business process view shows the “high-level structure and composition of a business process (or numerous processes), the services that are supplied, the assigned roles of actors, and the information used by the business process.” This process diagram includes “Junction” -elements to represent the process flow’s “fork” and “join.”
Below is an advanced process perspective. This is the operating model, which is based on the business model depicted in the above value stream diagram.

SIPOC (Suppliers, Inputs, Process, Outputs, Customers)
")
SIPOC (Suppliers, Inputs, Process, Outputs, Customers) is a Six Sigma tool that can be used to define aspects that are similar to all processes. This is a simple method for examining the business case: what value does the customer receive and how does he or she receive it.
Business Process View With Business Roles As “Swimlanes” of a Process – A Layered Approach
")
The customer is represented by “Business Role A,” and the customer journey path is represented by the topmost “swimline.”
Note that business roles (visualized as “swimlanes”) are nested inside process steps (activities), implying that these Business Roles are assigned to these Business Processes/process stages. As a result, this view is a hybrid of a layered view and a business process view.
The information and data flows are depicted in this version (flow relationship). The client travel path is represented by the upper “swimline” (activities connected with the triggering relationship).
 - Information Flow")
The service design methodology is represented below. The customer journey path (role A) is represented by the topmost “swimline,” which is related to the organization (roles B and C) via business services (1 and 2).
 - Services")
Layered Business Process View
This view can be used to represent a business process with both manual and automated steps.

Customer Journey Map View
When a client journey needs to be studied at a high level, this version is generated utilizing Motivation- and Strategy-elements.

When the customer service path needs to be examined in further detail, this version is generated using Business- and Application layer (core) parts.

The customer experience is the focus of this customer-centric view. This “service design”-related technique focuses on “outside-in” development of the service being created. This emphasizes the importance of services and products in providing value to customers – and indirectly to the organization. A customer journey route can be used to visualize a customer value stream that includes many application services and apps.
Service Blueprint View

This Service Blueprint view is centered on the customer and service, but it also highlights the “inside-out” aspect of the service. The service-driven development strategy can identify the underlying behavioral and structural implications of the service that is to be built with the help of this technique. As a result, this view adds process and functional factors to the customer-experience-driven approach.
This view can be found in a variety of forms. The information flows between the layers and elements are the subject of this example.
User Story View

User stories can be visualized using this view.
Cloud-Service Models View

Information View

The following abstraction levels can be used to model information: a) conceptual, b) logical, and c) physical. These layers of abstraction are depicted in the diagram above.
Conceptual Data Model View

Business objects, also known as concepts, that are employed in business operations are contained in the EA’s information architecture. A conceptual data model can be used to represent these concepts and their relationships.
“Service” Concept

The service concept is frequently problematic, as can be seen in a variety of ways. To make it obvious which service type is being discussed, it’s a good idea to use the prefix: business-, application-, or technology service. According to ITIL, IT service is tied to production service. As a result. The IT Service is the most closely related to the Application Services.
Service and Product

A product notion can be used to aggregate services as a composite element. Specification according to ArchiMate:
“A product represents a coherent collection of services and/or passive structure elements, accompanied by a contract/set of agreements, which is offered as a whole to (internal or external) customers.”
“A product may aggregate or compose business services, application services, and technology services, business objects, data objects, and technology objects, as well as a contract. Hence a product may aggregate or compose elements from other layers than the Business Layer. “
“A value may be associated with a product. The name of a product is usually the name which is used in the communication with customers, or possibly a more generic noun (e.g., “travel insurance”).”
Application Views
Application Services Map View

Applications Map View

Application portfolio, which can be separated into divisions depending on business units, for example.
Application Co-Operation View (Data flows)

Application Integration View (Dynamic relationships)
The examples (1–10) below show several different techniques to simulate data switching between applications.
- “Application A” owns the data object “A-1,” which “Application B” requests.
- “Application A” sends data to “Application B.”
- “Application A” creates the “A-1” service, which is used by “Application B.”
- In practice, “Application B” sends a request to “Application A-1” and receives a response…
")
Application Structure View
This view is important for designing or analyzing an application’s primary structure, sub-components, and associated data. This diagram can be used to break down the structure of an application system in development, to demonstrate modularization / decomposition: what are the sub-systems / sub-components that they supply, and what are the application services (or application interfaces) that they give.

The behavioral features supplied via the structural interfaces (GUIs and/or APIs in the picture below) are referred to as application services (figure above). “Different sides of the same coin” are Application Services and Application Interfaces.

Application Architecture View
Because there are both applications and application modules in the same view, this view combines EA and solution level techniques.

Application Component Model (CM)
The Application Component Model 0-n is a technique to modeling application architecture that consists of the following diagrams of various abstraction levels:
- The diagram at the CM-0 level depicts how the application interacts with its environment, including how it interacts with other apps and users. A black-box is used to represent the target application.
- The target application is broken down into modules (major components) and what application services (or application interfaces) those modules deliver and demand at the CM-1 level. A white-box is used to represent the target application.
- Modules are divided into sub-components at the CM-2 level. (The number of essential tiers varies depending on the circumstances.)
Application components and application services are depicted in the Application Component Model (CM) diagrams below. Depending on the situation, application interfaces can be used instead of application services. As always, it’s critical to use a modeling style that’s appropriate for the task at hand, and to model just those aspects that are sufficiently informative and add value. It is up to the modeller whether to highlight the functional features or to be more detailed and model, for example, the actual interfaces with precise nomenclature.
Application components and application services are depicted in the Component Model diagrams below. Instead of using application services, application interfaces might be used.
Application Component Model – 0 (CM-0)
")
Interactions between the target application and surrounding apps are depicted at the Component Model – 0 (CM-0) level (above). All necessary application services (or application interfaces) are described. The enterprise architecture level components and their services are represented at the 0-level of the diagram, with the target application in the middle.
Application Component Model – 1 (CM-1)
")
The Component Model – 1 (CM-1) level (above) shows how the target application is broken down into modules (or primary components), and which module is responsible for which application services (or application interfaces). Note! External apps are not required to be displayed at this level, but their services (or interfaces) are. When more low-level parts are displayed, more high-level elements can/must be omitted – for the purpose of clarity: to keep the diagram comprehensible.
Application Component Model – 2 (CM-2)
")
The Component Model – 2 (CM-2) level (shown above) depicts how the target application’s modules are made up of sub-components and interact.
Application Functions View
Decomposition of application functionalities: what are the system’s functions, and what application services do they provide?

Application Process View

The following is the nesting view of the application process view.

The following shows the internal content of the application process view.

Application Component Sequence Diagram View
Sequence diagrams aren’t exactly covered by ArchiMate; instead, they’re covered by UML. However, as demonstrated below, ArchiMate can be used to model sequences of operations executed by Application Components.
For modeling dynamics between application components, the dynamic relations “Trigger” and “Flow” can be employed. The layout of this view is similar to that of the UML sequence diagram.
Application Component Sequence Diagram View 2
This version (diagram below) shows how ArchiMate can be used to model the actions that internal elements of Application Components perform. Behavioral processes or functions, as well as structural sub-components, are examples of internal parts. Application Process-, Application Function-, and Application Component-elements are used to model them. These are only provided as alternatives.

The actions in this sequence diagram (above) are as follows:
- The sub-process “X” of Application Component “A” sends a request message to Application B with the parameter “A.”
- The sub-process “B-1” of Application Component “B” gets the incoming request and then (synchronously) calls Application Component C, where Application Function “Y” accepts the request, does certain actions, and returns back.
- The other sub-process “B-2” of Application Component “B” sends a message with parameters to Application Component D and receives acknowledgement. Sub-component “D” of Application Component “D” does the processing.
- The answer message from Application Component B is received by Application Component “A.”As shown here, we can model quite complex integration cases with combination of these elements (Application Component, Application Process and Application Function and relations (Trigger, Flow). UML sequence diagram has its own specialized purpose in software design, but ArchiMate can be utilized in quite a many modelling purposes – also in application design.
One of the most significant aspects of the enterprise architecture is application integration (EA). That is why it is useful if we can describe how applications switch data and what interaction methods are employed in more detail. Here’s a link to the book “Enterprise Integration Patterns,” which is a fantastic place to start learning about integration patterns.
The same idea of leveraging ArchiMate dynamic relationships Trigger and Flow, which may be used to model both synchronous and asynchronous messaging patterns, is utilized in a sequence with the end-user included (figure below) (request-response and callback, also publish-subscribe etc.).
ETL-process View

EAI / ESB View

Layered View

The Layered View can be used as a target area overview context diagram. The key benefit of this approach is that it shows how applications are used in business processes and what services they provide. For modeling different layers, the diagram above uses ArchiMate Grouping-element, whereas the diagram below uses the tool’s visual Group-element.
ArchiMate has three (3) layers, which are as follows: The three layers are: 1) the business layer, 2) the application layer, and 3) the technology layer. They are typically colored as follows: Yellow for the Business Layer, turquoise for the Application Layer, and green for the Technology Layer.

Application & Database View
A database is an important component of an organization’s overall corporate architecture. For example, “Client database,” “Customer database,” “Product database,” and so on. Alternatively, a database can be a logical (and physical) compilation of all of an application’s tables (e.g., “Customer table,” “Orders table,” “Invoices table,” and so on), which collectively form a database. A Data Object can be used to model a logical database (figure below), according to the ArchiMate standard. Chapter 9.4.1 “Data Object” states: “Typical examples of data objects are a customer record, a client database, or an insurance claim.” “A significant exception is when a data object is used to model a data collection with only one instance, such as a database.” ArchiMate includes a clever built-in system that allows you to apply the same concept to several levels of abstraction (and levels of details). As a result, the Data Object, for example, can be used to simulate a logical database, a database table, a message structure (switched across apps), and so on.

Database As an Application Component

Database Abstraction Levels:

Data Model View:

Use Case View
ArchiMate can be used to examine use cases from an application’s functional standpoint. As demonstrated in the diagram below, Use Cases (as defined by UML) can be mapped to Application Services.

A use case can be broken down into two categories: business use cases and system use cases (a.k.a. system cases). The diagram below shows how a “primary use case” might be represented by a Business Service, with subsequent system cases represented by Application Services.
")
When use cases are defined as application services, they can be used as pieces of target application functions in other diagrams (such as the layered view). In other words, application services represent an application’s behavior (functionalities). See the ArchiMate Cookbook, link, for more information on use case analysis.
Technology Views
Technology Architecture Layer Views.
Infrastructure View
This view depicts an application’s platform. This pattern can be used to model a run-time environment setup as well as the deployment of a business application.

Infrastructure View (nesting):
")
Implementation and Migration Layer / Transformation Architecture Layer Views
Implementation Roadmap View

Kanban View

The Kanban board is a tool for visualizing work and process. The Kanban board depicts how development needs, epics, user stories, and other items flow from the backlog to the ready state (Done). Depending on the volume and breadth of the development scenario, a Kanban board can be used for a variety of purposes. For example, “Epics” can be used at the EA level, and “User Stories” or “Requirements” can be used as work items at the project level. Depending on the situation, the granularity of task items can vary.
Generic View

This simplified representation can be used as a context diagram for a specific service, program, or project, for example.
Extras
Context Overview – The Milky Way Map
This is a technique for visualizing as much as possible in a single look. See The Milky Way Map with ArchiMate for more information.

Co-operation View
As demonstrated in the data flow diagram example below, the layers can be mixed.
")
Metamodel

These examples are created with Visual Paradigm Online.
Other Resources
- ArchiMate 3.1 Specification
- ArchiMate diagram tool – Visual Paradigm (Online)
- ArchiMate modeling tool – Visual Paradigm (Desktop)
This post is also available in Deutsche, Español, فارسی, Français, English, Bahasa Indonesia, 日本語, Polski, Portuguese, Ру́сский, Việt Nam, 简体中文 and 繁體中文.
