


Create A Control Chart
Control charts are a statistical process control tool used to determine if a manufacturing or business process is in a state of control. This video will show you how to create a control chart in Visual Paradigm Online.
What is A Control Chart
Control charts are a statistical process control tool used to determine if a manufacturing or business process is in a state of control. It is more appropriate to say that the control charts are the graphical device for Statistical Process Monitoring (SPM). Traditional control charts are mostly designed to monitor process parameters when the underlying form of the process distributions is known.

Control Chart Advantages & Disadvantages
Advantages
- Control charts can help you learn about changes that are always present in the process.
- You can see when something went wrong or might go wrong. These problem indicators let you know that corrective action is required.
- Control charts can predict future performance.
Disadvantages
Control charts only use data from recent measurements to draw conclusions about the process. This makes it very insensitive to shifts of 1.5 standard deviations or less.
How to create a control chart?
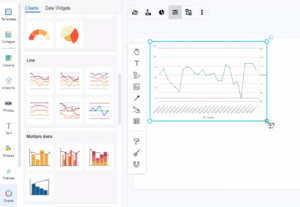
- In VP Online, you can create a control chart by selecting the Charts tool, then drag the control chart into your design.
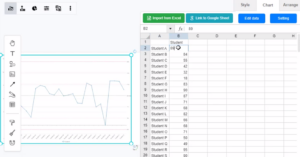
- You can go to Format Panel_ Chart_ Edit data_ to alter the data of the chart in a spreadsheet. Easily edit your data in an intuitive spreadsheet editor. Visual Paradigm Online makes it simple to enter your information and turn it into a stunning chart.
- The color of the lines can be adjusted under the Colors section of the format panel. Visual Paradigm Online supports a rich set of style options for all chart types. You can easily customize your chart to match your company’s brand colors and fonts or choose the color that matches your topic. Customize everything, from the fonts and colors to the position of titles and legends in a few clicks.
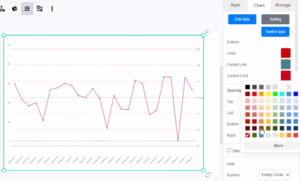
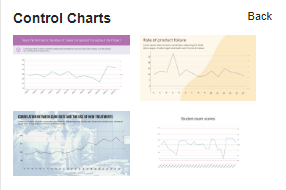
Chart Templates
Visual Paradigm Online free chart maker features a wide range of professional chart templates. You just need to select a template to get started, and then enter your data to get instant results. Try to choose a beautiful template that you want, and easily create your own control chart.
This post is also available in Deutsche, Español, فارسی, Français, English, Bahasa Indonesia, 日本語, Polski, Portuguese, Ру́сский, Việt Nam, 简体中文 and 繁體中文.
