


Create A Grouped Column And Line Chart
What Is A Grouped Column And Line Chart
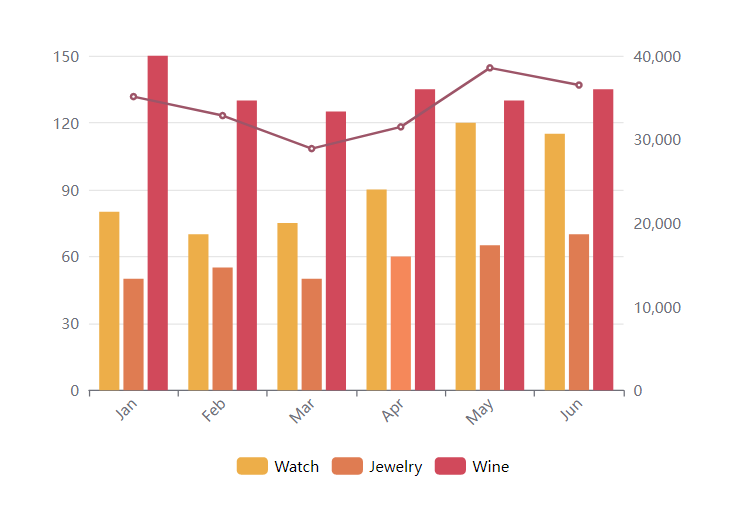
Grouped column And Line chart is a kind of combined chart consisted in grouped column chart and line chart. A line chart is placed on the top of a grouped column chart to show 2 sets of data together with widely difference.
When To Use Grouped Column And Line Chart
In a grouped column and line chart, Y-axis on both 2 sides are representing the value of the 2 sets of data.
In this case, the difference between the ranges of their data are usually very large. Otherwise, we can just add them as one a part of the grouped column chart without use a line chart to show the data. Therefore, grouped column and line chart is suitable to representing the trendy and difference of data in different range but having the same categories.
How To Create A Grouped Column And Line Chart
Edit Data
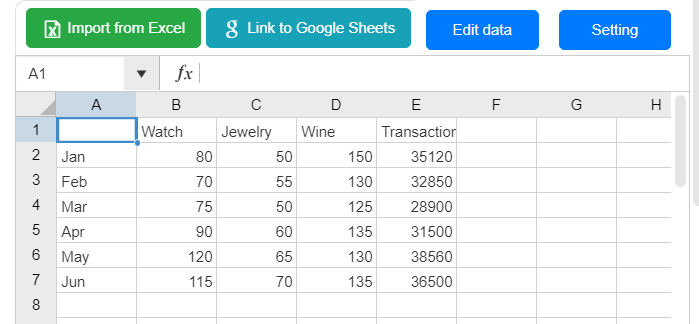
We can customize the data by editing the spreadsheet under Panel-Chart.
We can also import from Excel or link to Google Sheet.
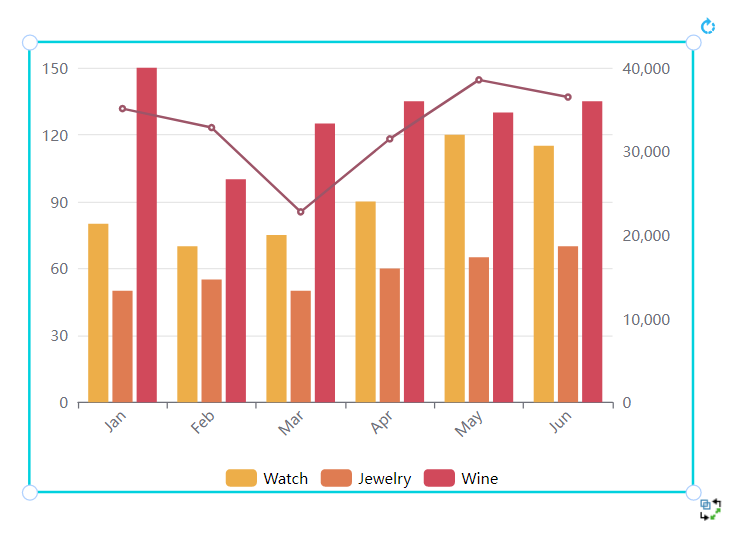
We can also drag and drop the lines and columns directly to change their value.
Customize the Chart
Color of the line and columns can be changed under Panel-Chart respectively.
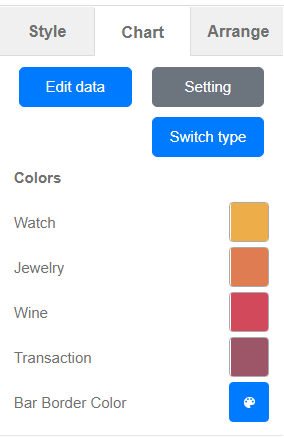
Other setting including the split line and area, X and Y axis, can be edited under the same panel.
Grouped Column And Line Chart Templates


This post is also available in Deutsche, Español, فارسی, Français, English, Bahasa Indonesia, 日本語, Polski, Portuguese, Ру́сский, Việt Nam, 简体中文 and 繁體中文.
