


Create a stacked column chart
Stacked column charts are a basic Excel chart type that allows comparisons between parts and wholes at different times or in different categories. In a stacked column chart, data series are stacked one on top of the other in vertical columns. This video will show you how to create a stacked column chart in Visual Paradigm Online.
What is a stacked column chart?
A stacked column chart consists of several vertically stacked series of columns, one after the other. The length of each series is determined by the value in each data point. Stacked column charts can show changes over time as it is easy to compare the length of the total columns. However, it is difficult to compare the relative sizes of the individual parts that make up each bar, except for the first set of data (next to the x-axis) and the total length of the column. Stacked column charts quickly become complex as the number of data series categories increases.

Stacked column chart Advantages & Disadvantages
Advantages
- Multiple categories and data series in compact space
- Can show change over time
Disadvantages
- Difficult to compare all but the first series
- Become visually complex as categories or series are added
How to create a stacked column chart?
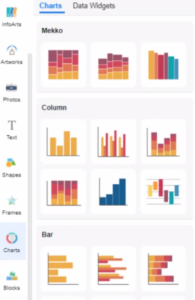
- In VP Online, you can create a stacked column chart by selecting the Charts tool, then drag out the stacked column chart into your design.
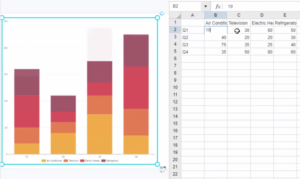
- You can go to Format Panel_ Chart_ Edit data_ to alter the chart’s data in a spreadsheet. Easily edit your data in an intuitive spreadsheet editor. Visual Paradigm Online makes it simple to enter your information and turn it into a stunning chart.
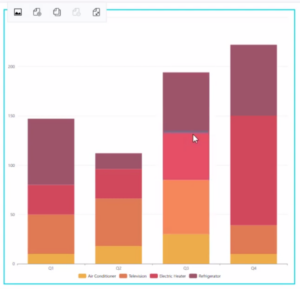
- You can also alter the chart data by directly drag & drop the columns in the chart.
- You can change the chart style in the Format panel. Visual Paradigm Online supports a rich set of style options for all chart types. You can easily customize your chart to match your company’s brand colors and fonts or choose the color that matches your topic. Customize everything, from the fonts and colors to the position of titles and legends in a few clicks.
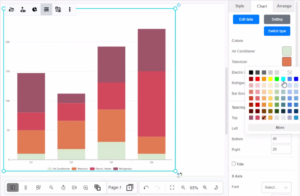
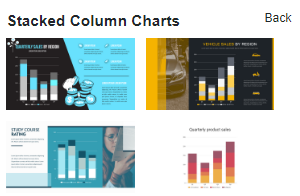
Chart Templates
Visual Paradigm Online free chart maker features a wide range of professional chart templates. You need to select a template to get started and enter your data to get instant results. Try to choose a beautiful template that you want, and easily create your own stacked column chart.
This post is also available in Deutsche, Español, فارسی, Français, English, Bahasa Indonesia, 日本語, Polski, Portuguese, Ру́сский, Việt Nam, 简体中文 and 繁體中文.
