


Create A Stream Graph
A streamgraph, or stream graph, is a type of stacked area graph which is displaced around a central axis, resulting in a flowing, organic shape. This video will show you how to create a stream chart in Visual Paradigm Online.
What is a Stream Graph?
A stream graph, or stream graph, is a type of stacked area graph which is displaced around a central axis, resulting in a flowing, organic shape. Unlike a traditional stacked area graph in which the layers are stacked on top of an axis, in a streamgraph, the layers are positioned to minimize their “wiggle”. More formally, the layers are displaced to minimize the sum of the squared slopes of each layer, weighted by the area of the layer. Streamgraphs display data with only positive values, and are not able to represent both negative and positive values.

Stream Graph Advantages & Disadvantages
Advantage
- Stream graphs are great for displaying large datasets in order to discover trends and patterns of various categories over time.
- Stream graphs can also be used to visualize the volatility of a large number of assets over a specific time period.
Disadvantages
- The downside of stream graphs is that they have legibility issues as they are often very cluttered by large datasets.
- The stream graph cannot read the exact values visualized in the stream graph because there are no axes to use as a reference.
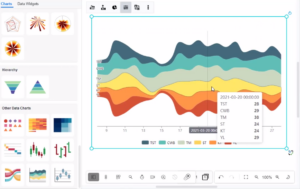
How to create a Stream Graph?
- In VP Online, you can create a stream graph by selecting the Charts tool, then dragging the stream graph into your design.
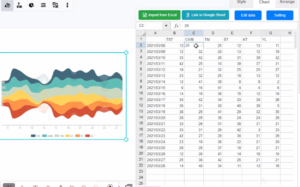
- You can go to Format Panel_ Chart_ Edit data_ to alter the data of the chart in a spreadsheet. Easily edit your data in an intuitive spreadsheet editor. Visual Paradigm Online makes it simple to enter your information and turn it into a stunning chart.
- The color of the streams can be adjusted under the Colors section of the format panel. You can change the chart style in the Format panel. Visual Paradigm Online supports a rich set of style options for all chart types. You can easily customize your chart to match your company’s brand colors and fonts or choose the color that matches your topic. Customize everything, from the fonts and colors to the position of titles and legends in a few clicks.
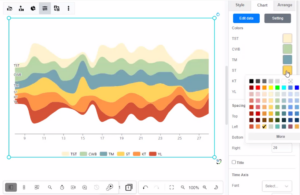
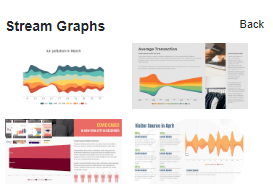
Chart Templates
Visual Paradigm Online free chart maker features a wide range of professional chart templates. You just need to select a template to get started, and then enter your data to get instant results. Try to choose a beautiful template that you want, and easily create your own stream chart.
This post is also available in Deutsche, Español, فارسی, Français, English, Bahasa Indonesia, 日本語, Polski, Portuguese, Ру́сский, Việt Nam, 简体中文 and 繁體中文.
