


How to Create a 100% Stacked Area Chart?
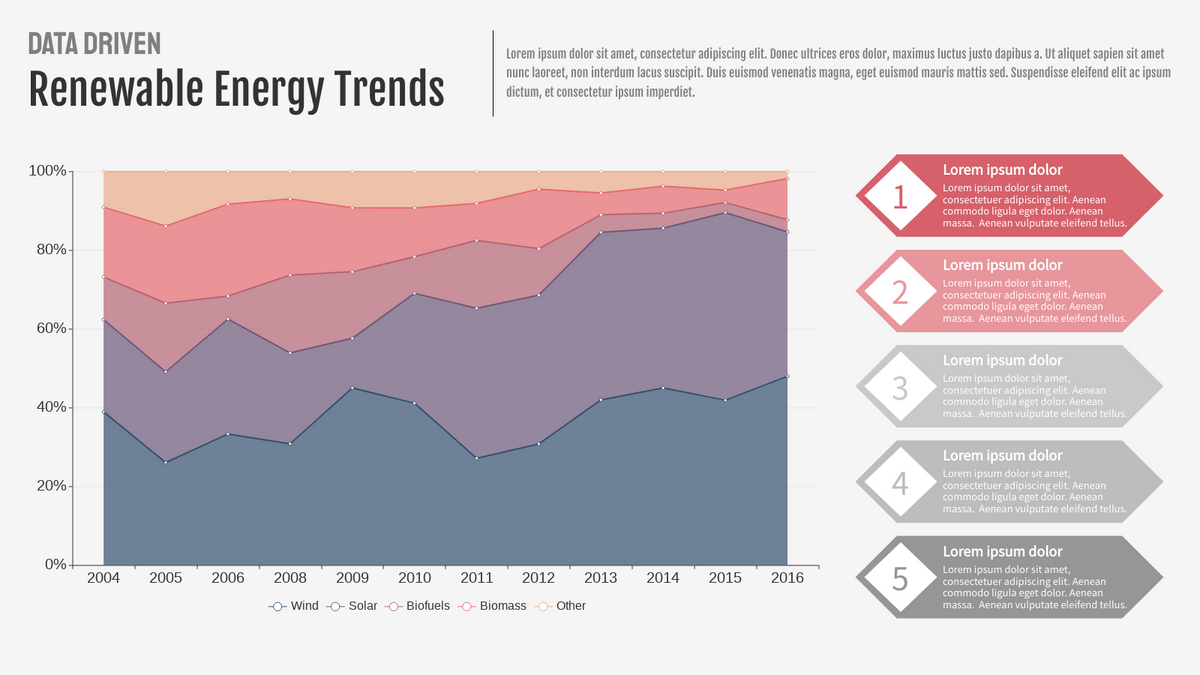
Stacked area table is best for illustrating the relationships between the different parts and helps show how each category contributes to the cumulative total. In this video, you can see how to create a 100% stacked area chart in VP Online.
Here is the steps to create your chart;
- Click charts and select the 100% stacked area chart on the left panel

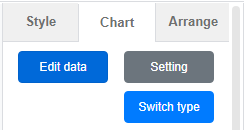
- Click chart panel then select “edit data”
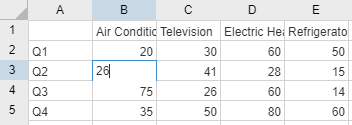
- Edit the data sheet as you desire
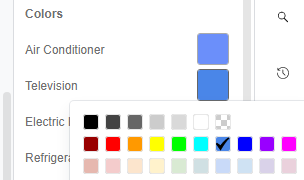
- Customise the chart’s style such as color tone and font
Would you like to create your own chart now? Create easily with Visual Paradigm Online. Here is some chart template you can try out now!

Marketing Course Attendance 100% Stacked Area Chart
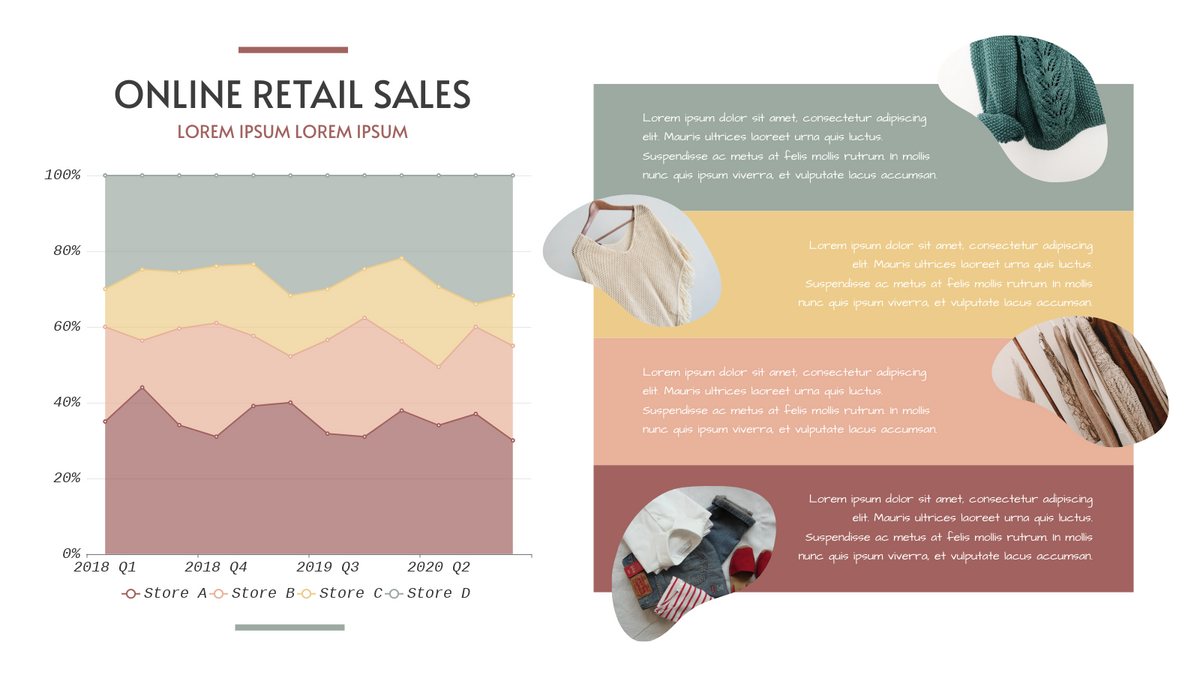
Online Retail Sales 100% Stacked Area Chart
This post is also available in Deutsche, Español, فارسی, Français, English, Bahasa Indonesia, 日本語, Polski, Portuguese, Ру́сский, Việt Nam, 简体中文 and 繁體中文.
