


How To Create A 100% Stacked Line Chart
What Is A 100% Stacked Line Chart
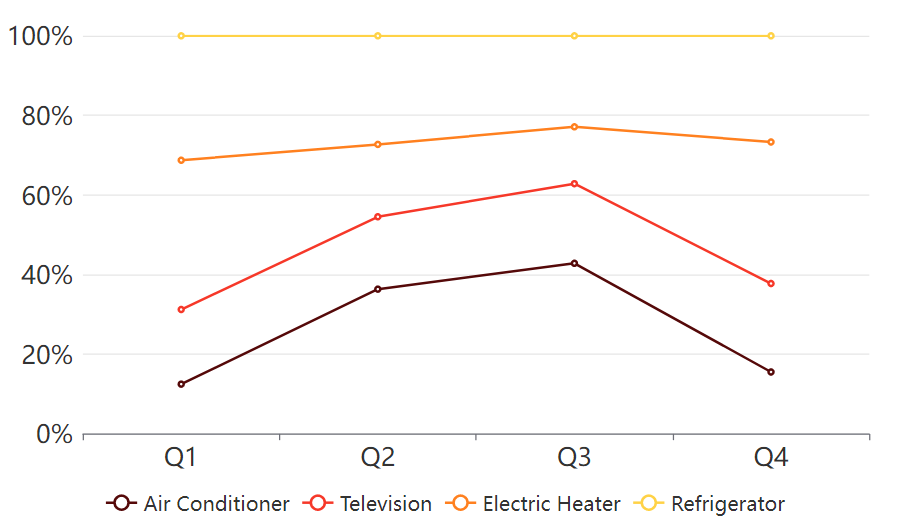
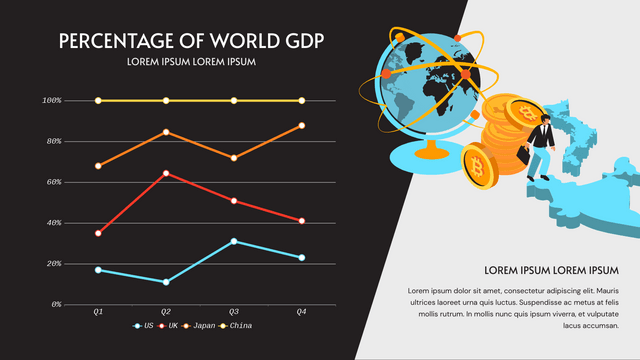
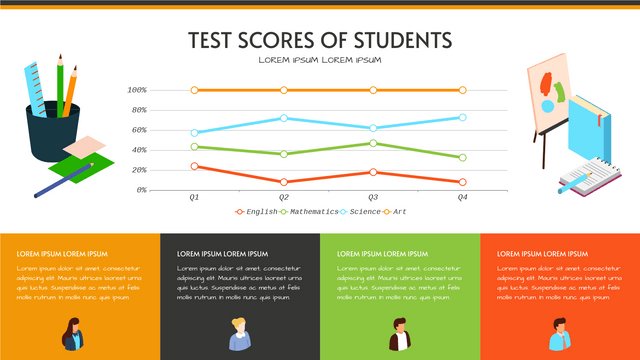
A 100% stacked line chart is a stacked line chart without any overlapping, as the lines are representing the summarize of data in different level. Each of the points represent the percentages of the data within 100%., while the top line should be a strange line as all of them are in 100%.

When To Use 100% Stacked Line Chart
When we are having different data column, and we want to add them together and shown the total trend of them, 100 stacked line chart will be a good choice for us.
It is good to show the trends of the data over a period of time, and we can also show the changes of the component values. However, as they are shown in the percentage instead of exact values, it may be difficult to find the exact value of part of it. We have to to think about what we are focusing when choosing the types of the charts we need.
How To Create A 100% Stacked Line Chart
Edit Data
To customize the data of the chart, we can click the “Edit data” under Panel-Chart and edit the spreadsheet.
We can also import the data from Excel, or link the chart with Google Sheet.
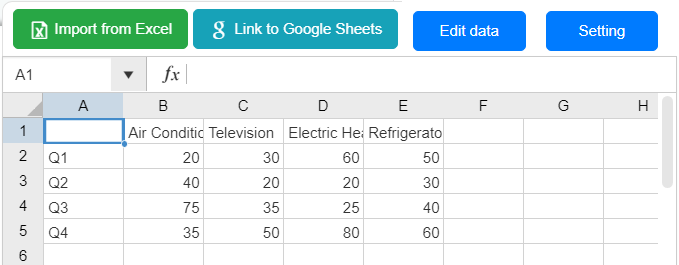
We can also directly drag and drop the points on the line to change the data.
Customize The Chart
We can change the color of the line under Panel-Chart.
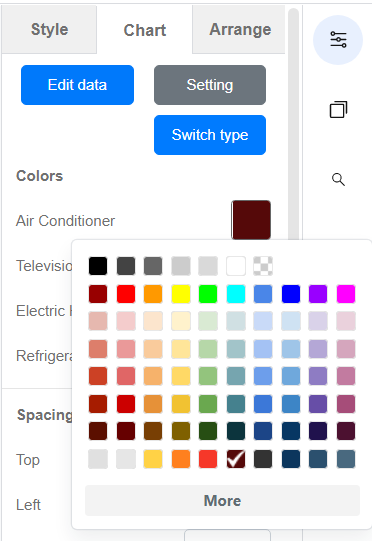
We can also do other customization under this panel, such as the X-axis, Y-axis, split lines, etc.
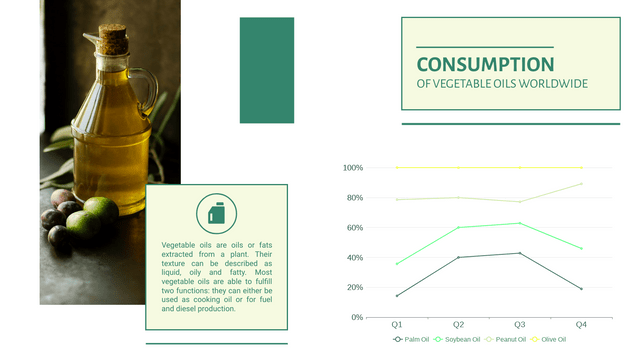
100% Stacked Line Chart Templates


This post is also available in Deutsche, Español, فارسی, Français, English, Bahasa Indonesia, 日本語, Polski, Portuguese, Ру́сский, Việt Nam, 简体中文 and 繁體中文.
