


How To Create A Bubble Chart
What Is A Bubble Chart
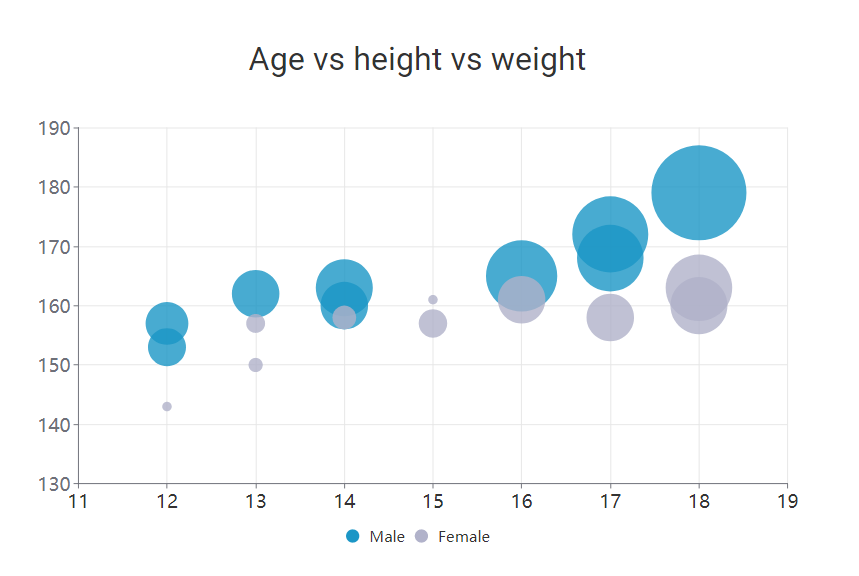
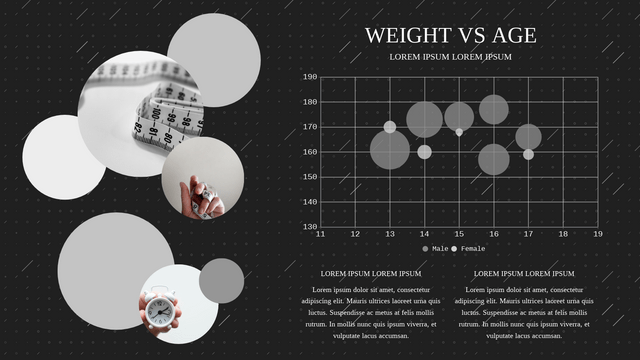
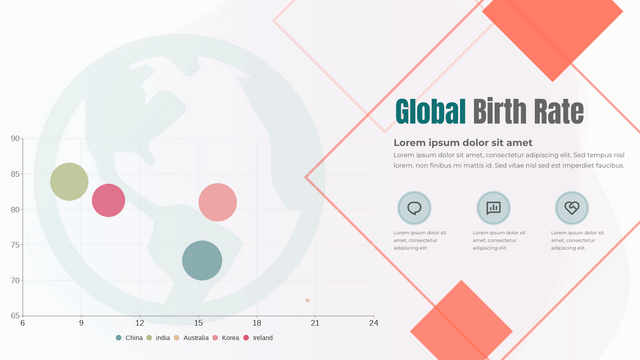
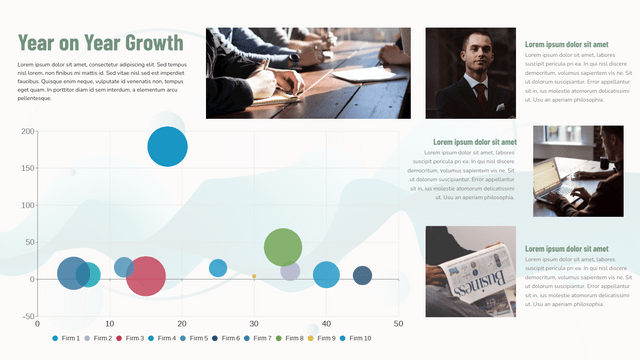
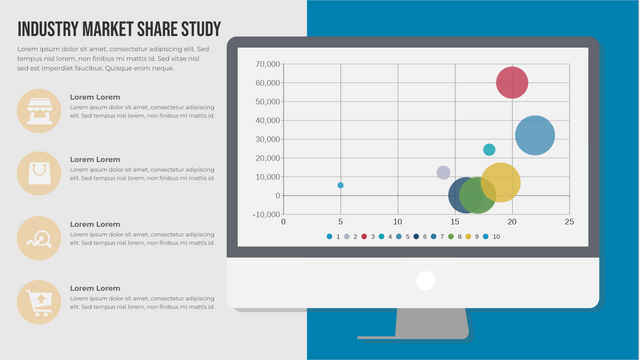
Bubble chart shows the data by bubbles in different sizes and position, while colors can be used to represent different categories. As they are drawn in the same scale, we can clearly see the trend of specific issues over time.
When To Use Doughnut Chart
When there are more than 3 sets of data is going to show in a chart, then bubble chart will be a good choice for you. As they are shown as a bubble instead of a point or column, it will be difficult to read the exact value easily. Therefore, we use bubble chart in case that we focus on the trend or relationship instead of the exact value.
How To Create A Doughnut Chart
Edit Data
By Edit Data under Panel-Chart, we can open the spreadsheet of the chart.
You can edit the data directly, import from Excel or link the spreadsheet with Google Sheet.
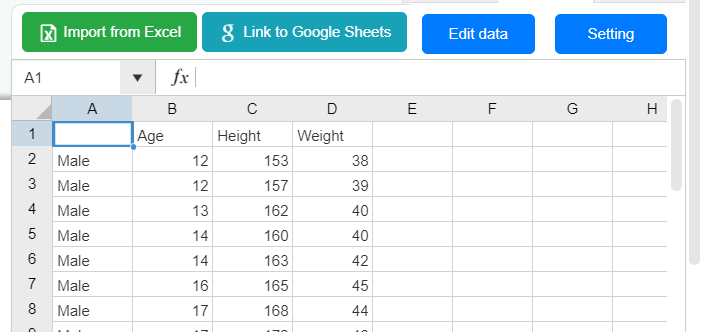
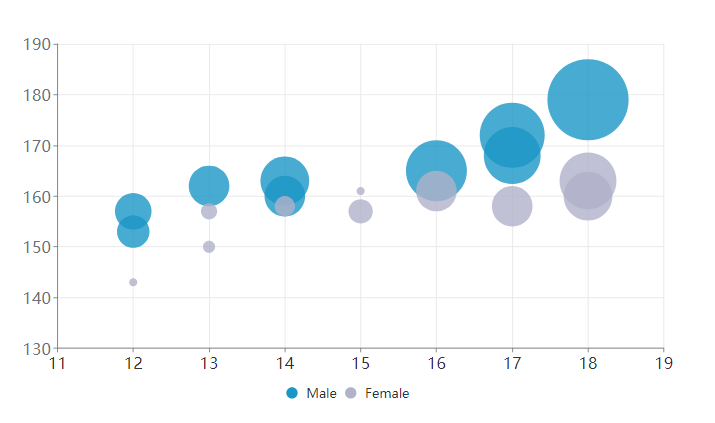
As the bubbles are representing 3 data by its size and position, we can change the data directly by moving and resizing the bubbles.
Customize The Chart
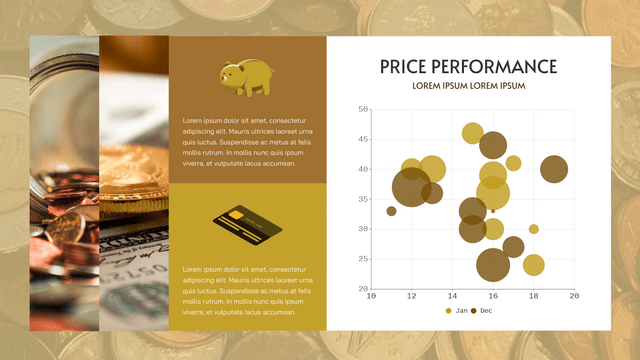
Color of Bubbles
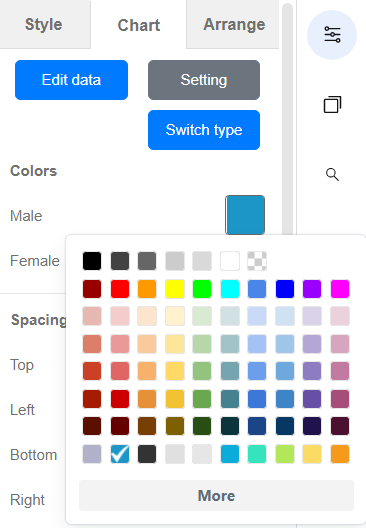
Colors of bubbles are very important in bubble chart as they are used to represent the categories of the data.
In this case, choose a nice and meaningful color for your bubbles will make the chart looks clearer and beautiful
Split Line And Split Area
Same as other chart, we can edit the setting of the x-axis and y-axis, the split line and area for bubble chart is a bit different.
Under x-axis and y-axis, there is another part about their split line, we can set them respectively as they there representing 2 sets of data.
We can also choose to show the split area. The split area can be shown horizontally or vertically.
In this case, the chart will be more focusing on one of the data.
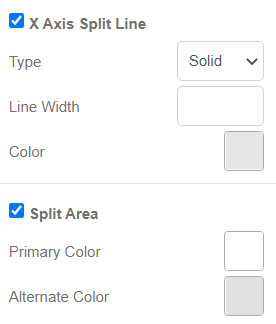
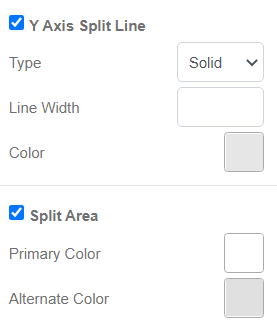
We can set the split line and split area according to our focusing point of the chart.
Bubble Chart Templates

This post is also available in Deutsche, Español, فارسی, Français, English, Bahasa Indonesia, 日本語, Polski, Portuguese, Ру́сский, Việt Nam, 简体中文 and 繁體中文.
