


How To Create A Column Chart
What Is A Column Chart
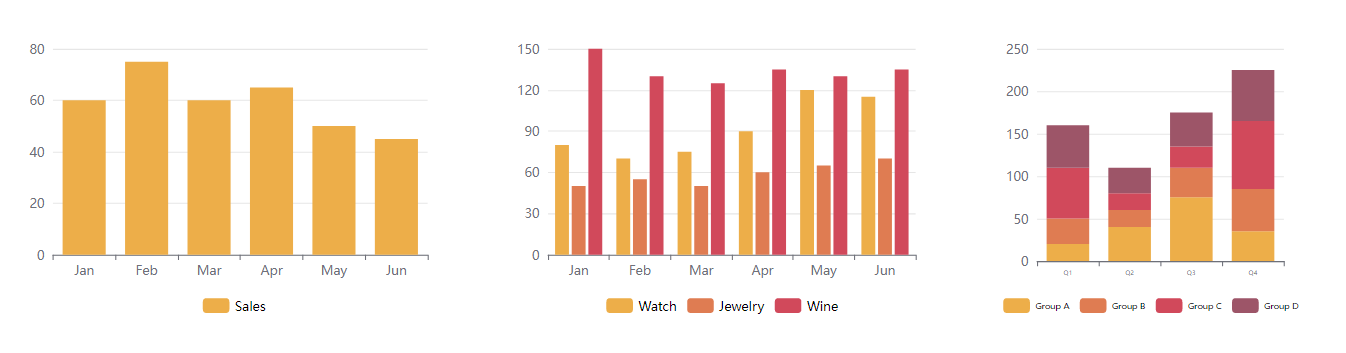
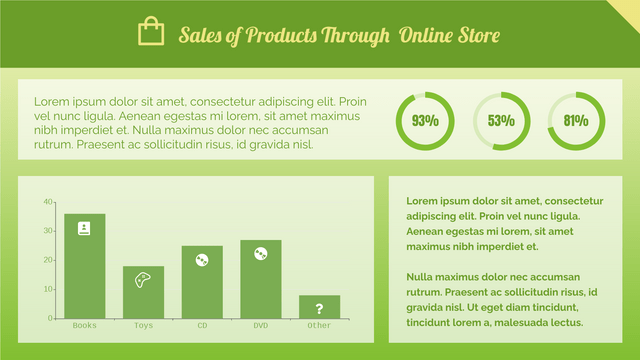
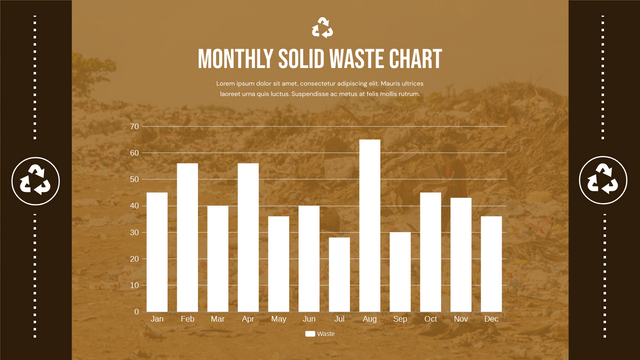
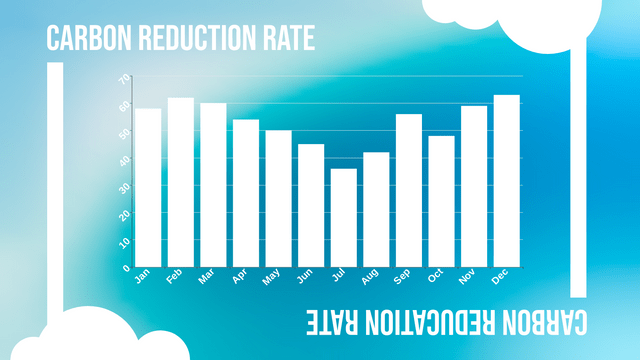
A bar chart is a type of chart or graph that displays categorical data as rectangular columns. It is a data visualization in which the height of the columns is proportional to the values they represent. Column charts are also known as vertical bar charts as they are closed in presentation.
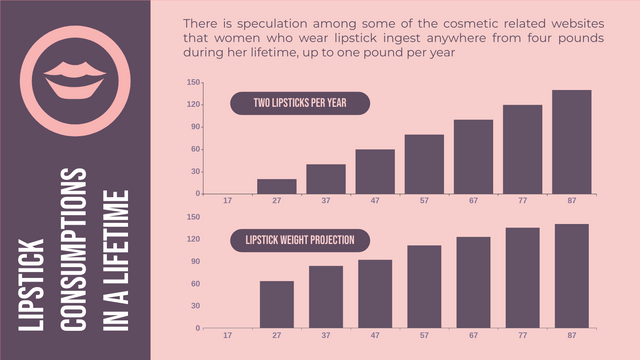
The column chart can be evolved into other charts, such as grouped column charts, stacked column charts, floating column charts, etc.
When To Use Column Chart
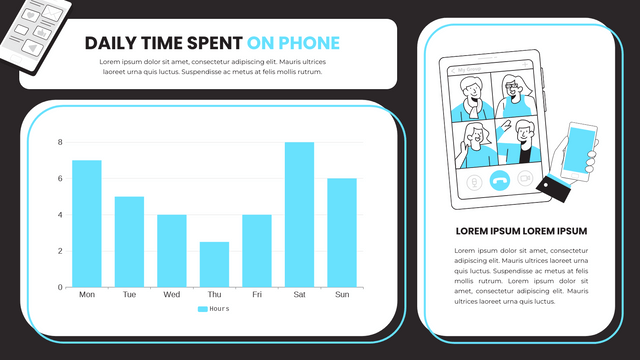
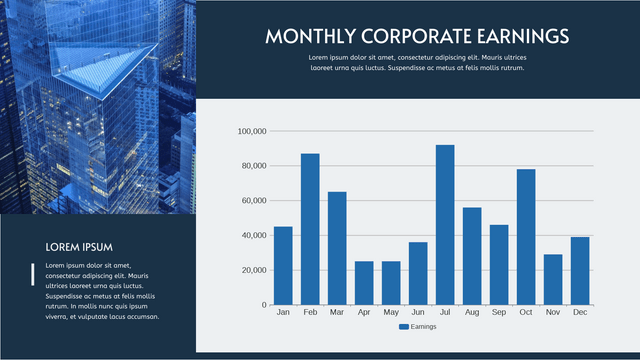
A column chart can not only record the data, but also comparing the difference of data. If it is data of different elements, column chart is good to show the value of different elements in the same category. If it is data recording based on time, a column chart can let us find the changes on the target over time. As the bars are shown in individual, it keeps the independence of the data, which is also commonly used in business uses, such as showing the sale of products, contribution of department or individual, etc.
Benefits of using Column Chart
- Summarize data and present it in a visual way
- Display time-based data in a clear way
- Display data from many categories clearly together
How To Edit A Column Chart In VP Online
Edit the Data
By the chart maker, we can choose to edit the chart to fulfill our needs.
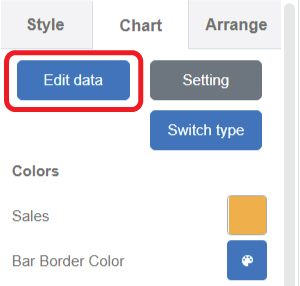
After dragging the column chart from the library, you can then go to panel Chart, then press “Edit data”.
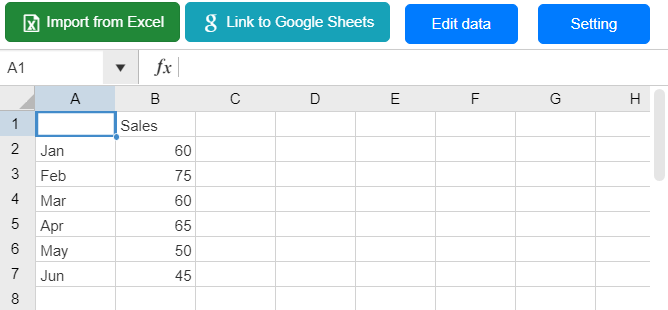
A table will come out, showing the data represented by the chart.
You can edit the data one by one, or import the existing data from Excel or Google Sheet.
In addition, you can directly drag and drop the columns to reach the value you need.
Customize The Chart
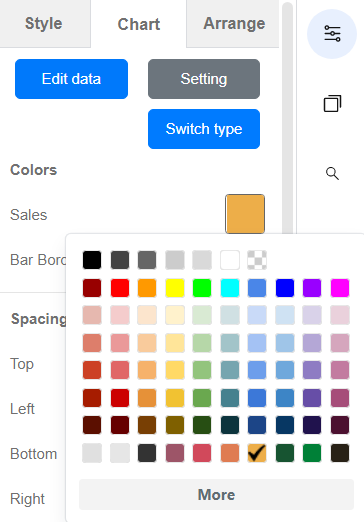
You can customize the chart by changing the color of the bar and the bar board.
Moreover, you can add title, customize the style of the X and Y axis, split line and legend under the panel Chart.
Change the style of the chart and fit your creation.
Column Chart Templates
This post is also available in Deutsche, Español, فارسی, Français, English, Bahasa Indonesia, 日本語, Polski, Portuguese, Ру́сский, Việt Nam, 简体中文 and 繁體中文.
