


Mobile device usage horizontal Infographic
Are you looking to create a high-quality infographic that is both informative and visually appealing? Look no further than Visual Paradigm Online, the premier online infographic maker.
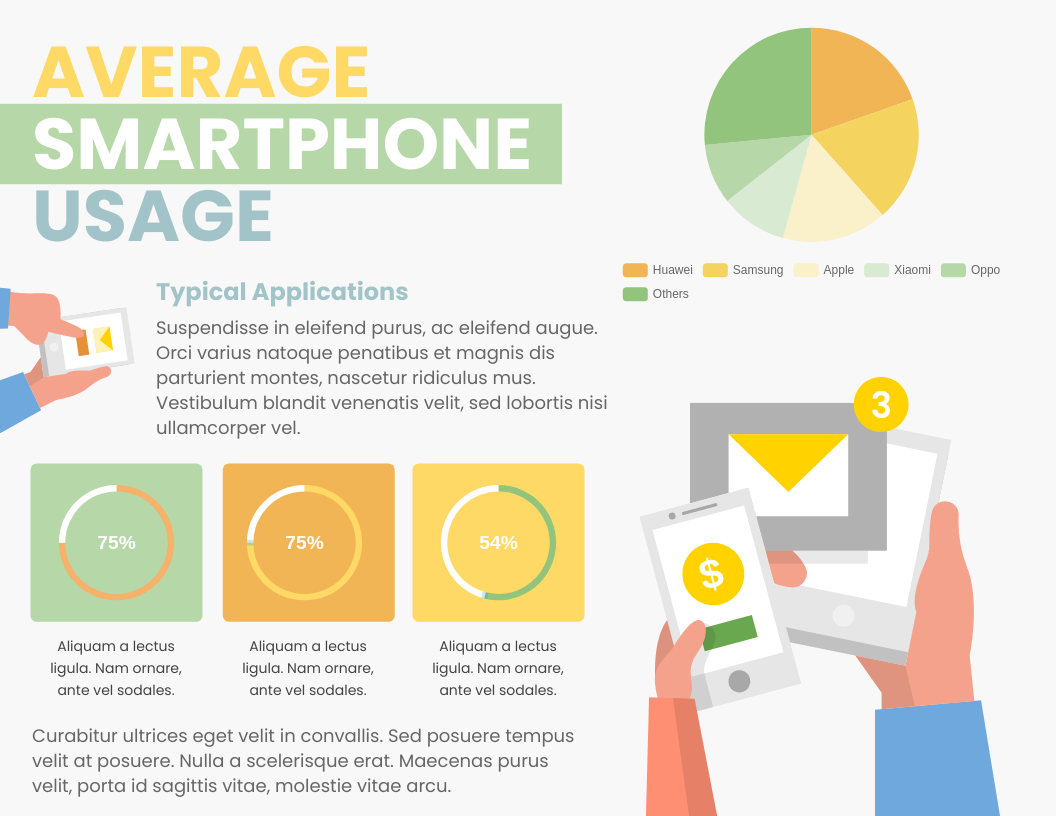
Our latest infographic, “Mobile device usage horizontal Infographic”, showcases our expertise in creating customizable designs that are perfect for businesses and organizations. This infographic highlights the usage patterns of mobile devices in a horizontal layout, making it easy to read and understand.
Customize this Infographic Template
Using Visual Paradigm Online’s online infographic tool, you can easily customize this design to fit your specific needs. With a wide range of design elements, icons, and templates to choose from, you can create an infographic that is truly unique and tailored to your audience.
Whether you’re looking to create an infographic for a marketing campaign, a presentation, or simply to share information with your team, Visual Paradigm Online’s graphic design editor is the perfect choice. Our intuitive interface and powerful features make it easy to create professional-quality designs in just minutes.
So why wait? Visit our graphic design template library to get started, or learn more about Visual Paradigm Online’s infographic maker by clicking here. With our online infographic maker, creating stunning visuals has never been easier.
- More about Visual Paradigm Online’s graphic design editor:
https://online.visual-paradigm.com/infoart/ - Graphic design template library:
https://online.visual-paradigm.com/infoart/templates/
What is the most popular mobile operating system in the world?
The most popular mobile operating system in the world is Android, developed by Google. As of 2021, Android has a global market share of over 70%, with more than 2.5 billion active devices. The popularity of Android can be attributed to its open-source nature, allowing for greater customization and a wider range of device options. Apple’s iOS comes in second place, with a market share of around 28%.
This post is also available in Deutsche, Español, فارسی, Français, English, Bahasa Indonesia, 日本語, Polski, Portuguese, Ру́сский, Việt Nam, 简体中文 and 繁體中文.
