Como Criar Um Gráfico De Bolhas
O que é um gráfico de bolhas
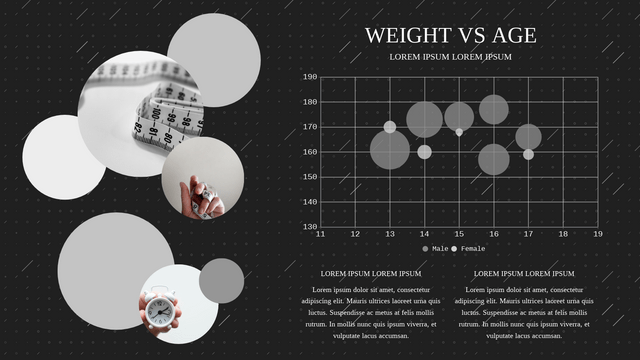
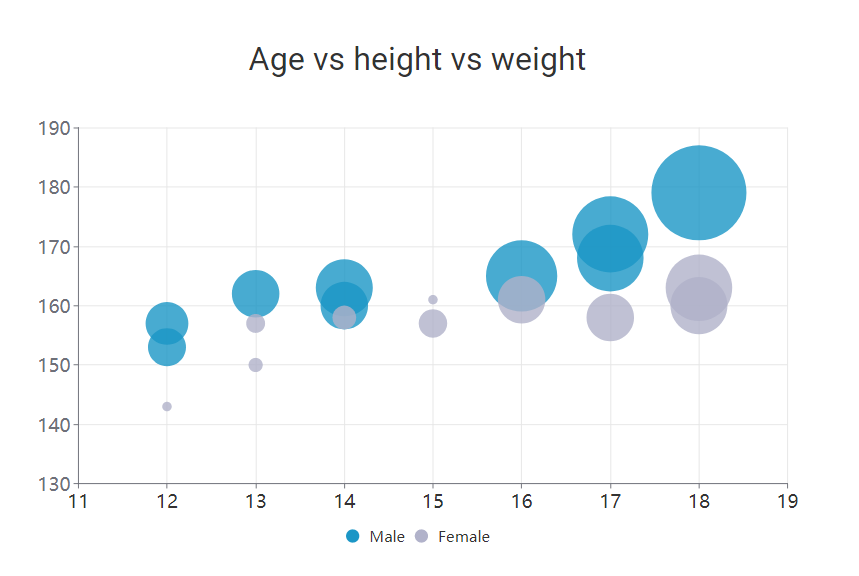
O gráfico de bolhas mostra os dados por bolhas em diferentes tamanhos e posições, enquanto as cores podem ser usadas para representar diferentes categorias. Como eles são desenhados na mesma escala, podemos ver claramente a tendência de questões específicas ao longo do tempo.
Quando usar o gráfico de rosca
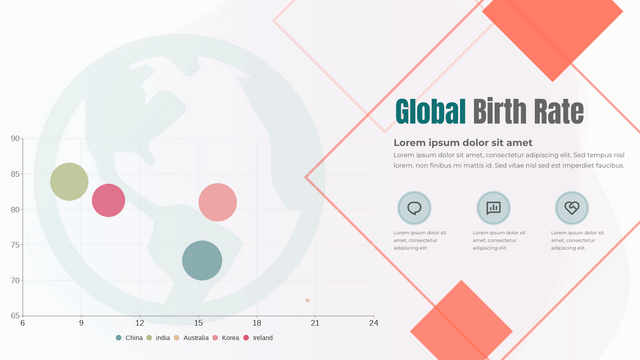
Quando houver mais de 3 conjuntos de dados que serão exibidos em um gráfico, o gráfico de bolhas será uma boa opção para você. Como eles são mostrados como uma bolha em vez de um ponto ou coluna, será difícil ler facilmente o valor exato. Portanto, usamos o gráfico de bolhas caso nos concentremos na tendência ou relacionamento em vez do valor exato.
Como criar um gráfico de rosca
Editar dados
Por Editar Dados em Painel-Gráfico, podemos abrir a planilha do gráfico.
Você pode editar os dados diretamente, importar do Excel ou vincular a planilha ao Google Sheet.
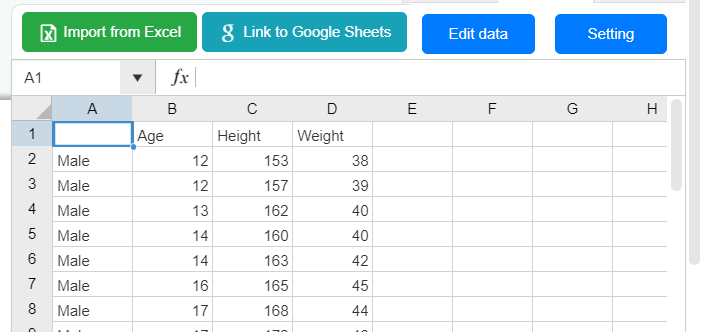
Como as bolhas estão representando 3 dados pelo seu tamanho e posição, podemos alterar os dados diretamente movendo e redimensionando as bolhas.
Personalizar o gráfico
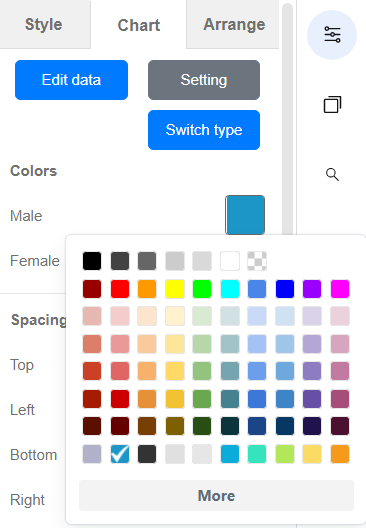
Cor das Bolhas
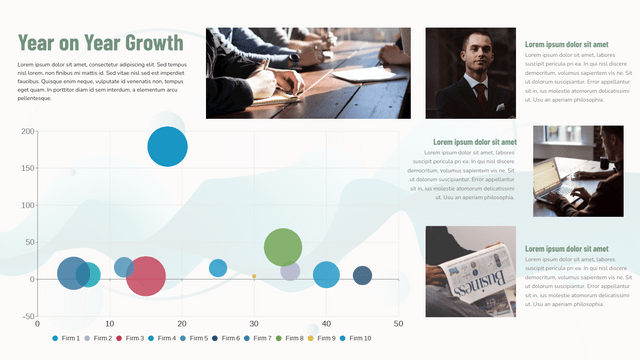
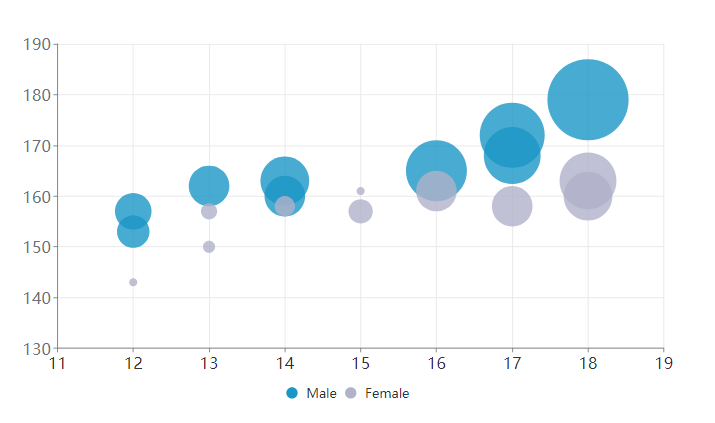
As cores das bolhas são muito importantes no gráfico de bolhas, pois são usadas para representar as categorias dos dados.
Neste caso, escolha uma cor agradável e significativa para suas bolhas para tornar o gráfico mais claro e bonito
Linha dividida e área dividida
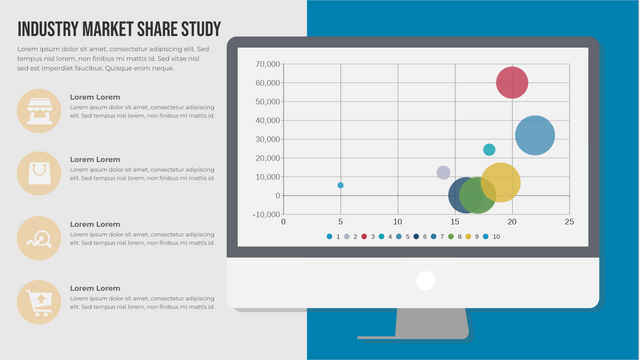
Same as other chart, we can edit the setting of the x-axis and y-axis, the split line and area for bubble chart is a bit different.
Under x-axis and y-axis, there is another part about their split line, we can set them respectively as they there representing 2 sets of data.
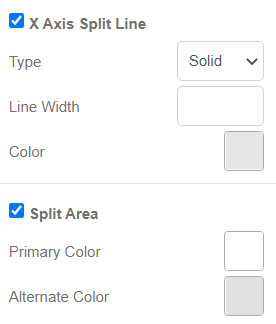
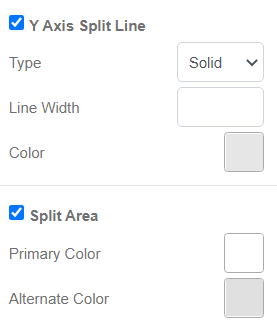
We can also choose to show the split area. The split area can be shown horizontally or vertically.
In this case, the chart will be more focusing on one of the data.
We can set the split line and split area according to our focusing point of the chart.
Bubble Chart Templates