


UML – A Comprehensive Guide
What is UML?
UML is a standard notation for object-oriented methods, which was created by unifying Object Modeling Techniques. It is used for analysis, design and deployment of systems. The Unified Modeling Language was designed to respond to the needs of businesses to automate the production of software, improve quality and reduce cost and time-to-market. It also provides a formal basis for understanding the modeling language.
Why UML?
Large enterprise applications must be structured in a way that enables scalability, security, and robust execution under stressful conditions. A well-designed architecture enables code reuse, and allows maintenance programmers to find and fix bugs that show up long after the original authors have moved on to other projects. Modeling is essential to large software projects, and helps medium and small projects as well. A model ensures that business functionality is complete and correct, end-user needs are met, and program design supports requirements for scalability, robustness, security, extendibility, and other characteristics.
- Models help us to work at a higher level of abstraction by hiding or masking details, bringing out the big picture, or focusing on different aspects of the prototype.
- UML lets you model any type of application, running on any type of hardware, operating system, programming language, and network, and it can be used to model non-OO applications as well.
- Some tools analyze existing source code (or, some claim, object code!) and reverse-engineer it into a set of UML diagrams, while others execute UML models, typically generating program language code that runs quickly if the code generator incorporates best-practice scalable patterns.
- The process of gathering and analyzing an application’s requirements and incorporating them into a program design is complex. UML is a language that enables you to express the results of your analysis and design.
Where did it come from?
UML has its roots in the object-oriented programming methods developed in the late 1980s and early 1990s. Jim Rumbaugh, Grady Booch and Ivar Jacobson merged their ideas into the Unified Method, which was later called the Unified Modelling Language (UML). The first Request for Proposal (RFP) issued by the Object Management Group (OMG) provided the catalyst for several organizations to join forces around producing a joint RFP response. The RFP response, UML 1.0, was well-defined, expressive, powerful, and generally applicable and enhanced 1.1 to 1.5, and subsequently to UML 2.1 from 01 to 06 (now the UML current version is 2.5)

Benefits of UML
The best benefit of using UML is that the diagram’s codes are easily readable by any programmer that understands even a tiny fraction of the program.
- UML is a standard used to visually describe a program. It is widely used and accepted as the language for outlining programs.
- A UML diagram shows the relationships between classes and entities in a computer program. It is easy to understand a program’s relationships by looking at the diagram.
- A UML diagram helps explain relationships in a program in a straightforward manner, and allows a programmer to reuse portions of code that already exist rather than rewrite those functions.
- UML is the current standard for programming in object-oriented programming languages. It helps to plan a program before the programming takes place, and generates code based on the classes set up in the model.
UML Diagrams and Model – Structure vs Behavior
A UML diagram shows how a system’s components interact with other components and how it will run. A UML model is a complete graphic representation of a system’s model, while a diagram is a partial representation.
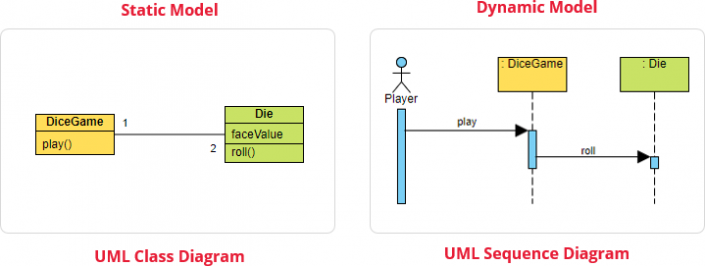
Static vs Dynamic View
Static modeling shows the structure of the system using objects, attributes, operations, and relationships, while dynamic modeling shows the behavior of the system using collaborations among objects and changes to the internal states of objects.
- Structure diagrams represent the static aspects of a software system. They are used to document the software architecture of software systems.
- Behavior diagrams describe the dynamic aspect of a system. They are used to describe the functionality of software systems.
14 Types of UML Diagrams
UML 2.2 has 14 types of diagrams, of which 7 represent structural information and 7 represent general aspects of interactions.
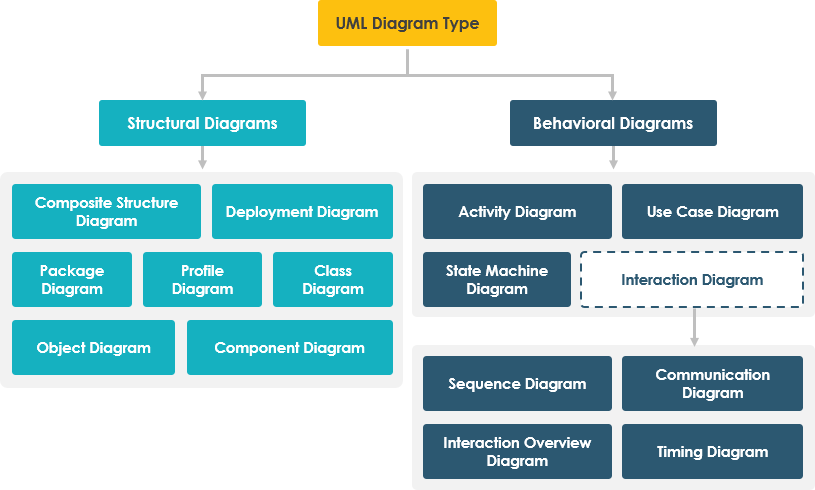
Structure Diagrams
Since structure diagrams represent the structure, they are used extensively in documenting the software architecture of software systems. Structure diagrams depict the static structure of the elements in your system. The Seven UML structural diagrams are roughly organized around the major groups of things you’ll find when modeling a system.
For example, the component diagram describes how a software system is split up into components and shows the dependencies among these components.
| Structural Diagram | Brief Description |
| Composite Structure Diagram | It shows the internal structure of a classifier, classifier interactions with the environment through ports, or behavior of a collaboration. |
| Deployment Diagram | It shows a set of nodes and their relationships that illustrates the static deployment view of an architecture. |
| Package Diagram | It groups related UML elements into a collection of logically related UML structure. |
| Profile Diagram | |
| Class Diagram | It shows a set of classes, interfaces, and collaborations and their relationships, typically, found in modeling object-oriented systems. |
| Object Diagram | It shows a set of objects and their relationships, which is the static snapshots of instances of the things found in class diagrams. |
| Component Diagram | It shows a set of components and their relationships that illustrates the static implementation view of a system. |
Behavioral diagrams
UML’s five behavioral diagrams are used to model the behavior of a system. They show how data moves through the system, how objects communicate with each other, how the passage of time affects the system, and what events cause the system to change internal states.
| Behavioral Diagram | Brief Description |
| Activity Diagram | It is a graphical representations of workflows of stepwise activities and actions with support for choice, iteration and concurrency |
| Use Case Diagram | It describes a system’s functional requirements in terms of use cases that enable you to relate what you need from a system to how the system delivers on those needs. |
| State Machine Diagram | It shows the discrete behavior of a part of a designed system through finite state transitions. |
| Sequence Diagram | It shows the sequence of messages exchanged between the objects needed to carry out the functionality of the scenario. |
| Communication Diagram | It shows interactions between objects and/or parts (represented as lifelines) using sequenced messages in a free-form arrangement. |
| Interaction Overview Diagram | It depicts a control flow with nodes that can contain other interaction diagrams. |
| Timing Diagram | It shows interactions when the primary purpose of the diagram is to reason about time by focusing on conditions changing within and among lifelines along a linear time axis. |
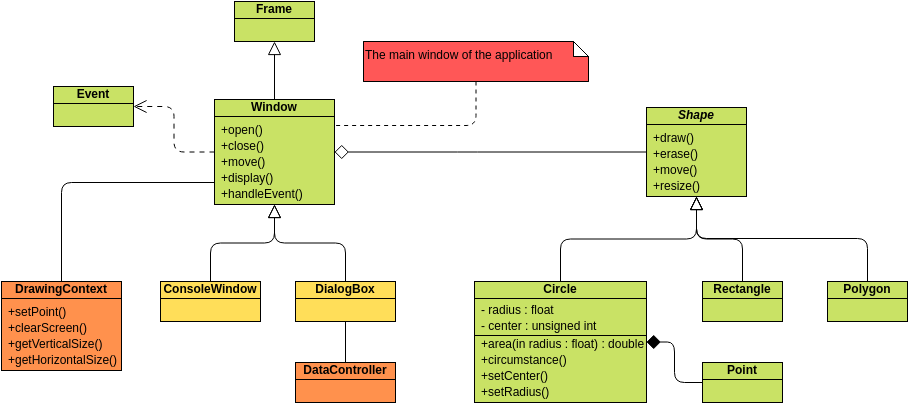
1. Class Diagram
A class diagram depicts a static view of an application, and helps in constructing executable software code. It shows the attributes, classes, functions, and relationships to give an overview of the software system. They are used to build a static view of an application. An object model diagram can reduce maintenance time by providing a general schematic of an application before coding.
Depending on the complexity of a system, you can use a single class diagram to model an entire system, or you can use several class diagrams to model the components of a system. Class diagrams are fundamental to the object modeling process and model the static structure of a system. In the analysis stage, a class diagram can help you to understand the requirements of your problem domain and to identify its components.
The class diagram is the main building block of object-oriented modeling. it shows the structure of an object oriented system by showing classes, their attributes, operations, and relationships among objects. The top compartment contains the name of the class, the middle compartment contains its attributes, and the bottom compartment contains its operations.
Relationships are written in the middle of the association line. They often have a small arrowhead to show the direction to read the relationship. The multiplicity of objects in a relationship can be expressed as: Exactly one, zero, one, many, one or more.
- A class is a blueprint for an object, and the point of Object-Oriented Design is not about objects, but about classes, because we use classes to create objects.
- The choice of perspective depends on how far along you are in the development process. Analysis models feature a mix of conceptual and specification perspectives.
- UML class relationships are used to convey how code should be implemented from diagrams. If precisely interpreted, the implemented code will accurately reflect the intent of the designer.
- An association is represented by a line connecting two classes. At each end, we can indicate ownership, the role the elements of that end play, and the multiplicity of instances.
- A generalization is a relationship between two classes. Each instance of the specific class is also an indirect instance of the general class.
- An aggregation is a type of association that represents a part-whole or part-of relationship. It can be represented graphically by a hollow diamond shape on the containing class with a single line connecting it to the contained class.
- A dependency relationship exists when an object of one class uses an object of another class.
- The abstract class is used to find functionalities across classes, and its name is written in italics.
2. Object Diagram
An object is an instance of a class in a particular moment in runtime, and an object diagram shows the detailed state of a system at a point in time. They are used to show examples of data structures, and class diagrams are used to verify the accuracy and completeness of object diagrams.
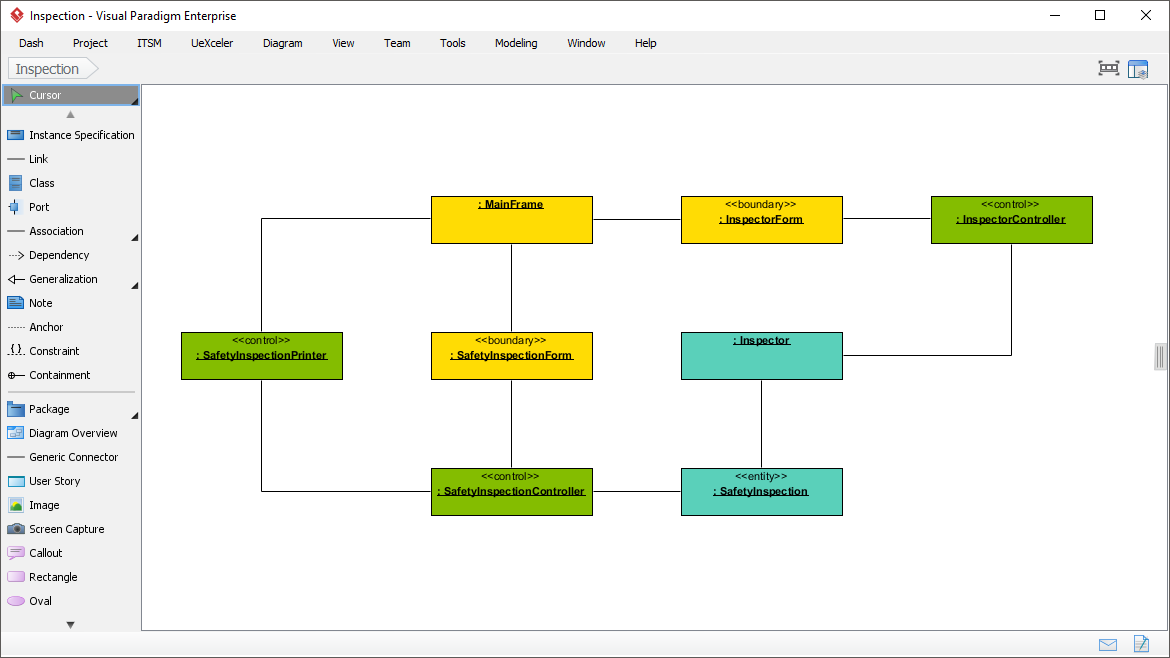
(Created with Visual Paradigm (Desktop)’s Object Diagram tool)
- An object diagram shows the relation between objects in a system, and can be used to explain complex system class diagrams.
- In UML, object diagrams show the instances of the classifiers in models and their relationships. You can create object diagrams by instantiating the model elements in class, deployment, component, and use-case diagrams.
- To develop an object diagram, you must identify the mechanisms that make up the system, and then identify the classes, interfaces, and other elements that participate in the mechanism, and also identify the relationships among these things.
- An object diagram can be used to show the state of objects at a particular point in time.
3. Component Diagram
A component diagram is used to break down a large object-oriented system into smaller components. It visualizes the relationships as well as the organization between the components present in the system. A component diagram is a representation of a software system’s logical components and their relationships which is a static implementation view of a system. It is typically used to visualize the components, construct executables, and describe the organization and relationships of the components.
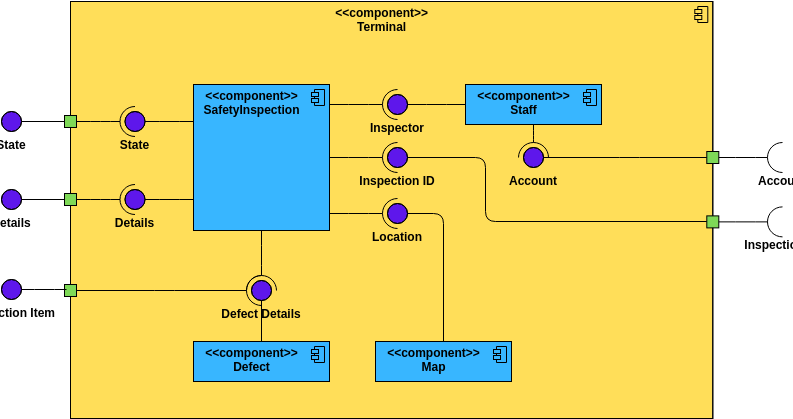

Edit this UML Component Diagram
- The component diagram illustrates the provided and required interfaces of a component.
- A component is a modular part of a system. It is drawn as a rectangle with optional compartments stacked vertically.
- A lollipop or socket is used to illustrate a dependency from a component to an interface, and a half-circle is used to illustrate a dependency from a component to a required interface.
4. Deployment Diagram
A deployment diagram shows the structure of the run-time system and the communication paths between different items of hardware that software will be deployed. A deployment diagram is a collection of vertices and arcs that show the relationships among nodes in a system. It is useful for system engineers to control performance, scalability, maintainability, and portability.
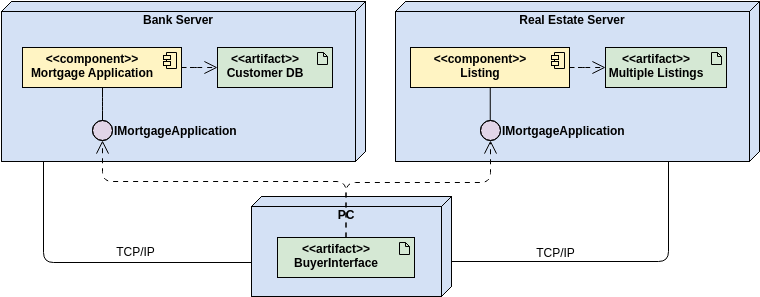
Edit this Deployment Diagram Online
Deployment diagrams show the architecture of a system as deployment of software artifacts to deployment targets. They could be either specification level (also called type level) or instance level (similar to class diagrams and object diagrams).
Deployment vs Component Diagram
- Deployment diagrams are used to describe the hardware components used to deploy software components in a system.
- Component diagrams are used to describe the software artifacts of a system and deployment diagrams are used to describe the hardware topology of a system.
5. Package Diagram
Packages are used to group semantically related elements to organize high level system elements of complex systems. A package diagram is a pattern for grouping elements and defining their interdependencies. They separate model elements and components into consistent units or systems. These diagrams simplify system access control, model navigation, configuration management, and other semantic considerations.
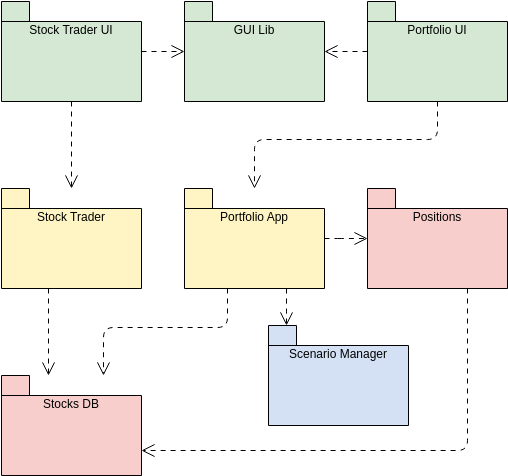
- Packages are shown using a folder symbol, and models are shown using a triangle in the top right corner.
- A package diagram follows hierarchal structure of nested packages for example, a package diagram can also group use cases into logically related subsystems.
- A dependency exists between two packages if any class in package A depends on any class in package B, or if a client – server relationship exists between two classes.
- Package diagrams allow us to specify dependencies between packages. A dependency is modelled by a dashed arrow.
- A package import relationship is interpreted as importing elements from the target package into the source package.
- A package merge is a directed relationship between two packages. It adds the characteristics of the target package to the characteristics of the source package.
- A package is a container for other model elements. A package can be hierarchically nested, and the container can be deleted or copied without deleting the elements it contains.
6. Composite Structure Diagram
In UML models, a composite structure diagram depicts the internal structure of structured classifiers by using parts, ports, and connectors
(Created with Visual Paradigm (Desktop)’s Composite Structure Diagram tool)
-
Parts: a diagram element that represents a set of one or more instances that a containing structured classifier owns
- A connector binds ports together, a collaboration binds instances together, a structured classifier represents a class that can be described by interactions between parts, and an encapsulated classifier contains ports.
-
Ports: define the interaction point between a classifier instance and its environment or between the behavior of the classifier and its internal parts
- Interface: it can be modelled as a class, but it is not instantiated. A concrete class must implement the interface, and external entities can use the interface without worrying about the internal implementation.
-
Collaborations: use a collaboration use to define only the roles and connections that are required to accomplish a specific goal of the collaboration
Class vs Object vs Composite Structure Diagram
- Class diagrams show the relationships between classes that make up a complex structure, while object diagrams show specific instances of that structure.
- Composite structure diagrams show how the components interact.
7. Profile Diagram
UML is a general purpose modeling language. However, in some circumstances, a language optimized for the given domain is advantageous. Profile diagrams allow customizing UML models for particular domains and platforms. These diagrams are defined using stereotypes, tagged value definitions, and constraints.
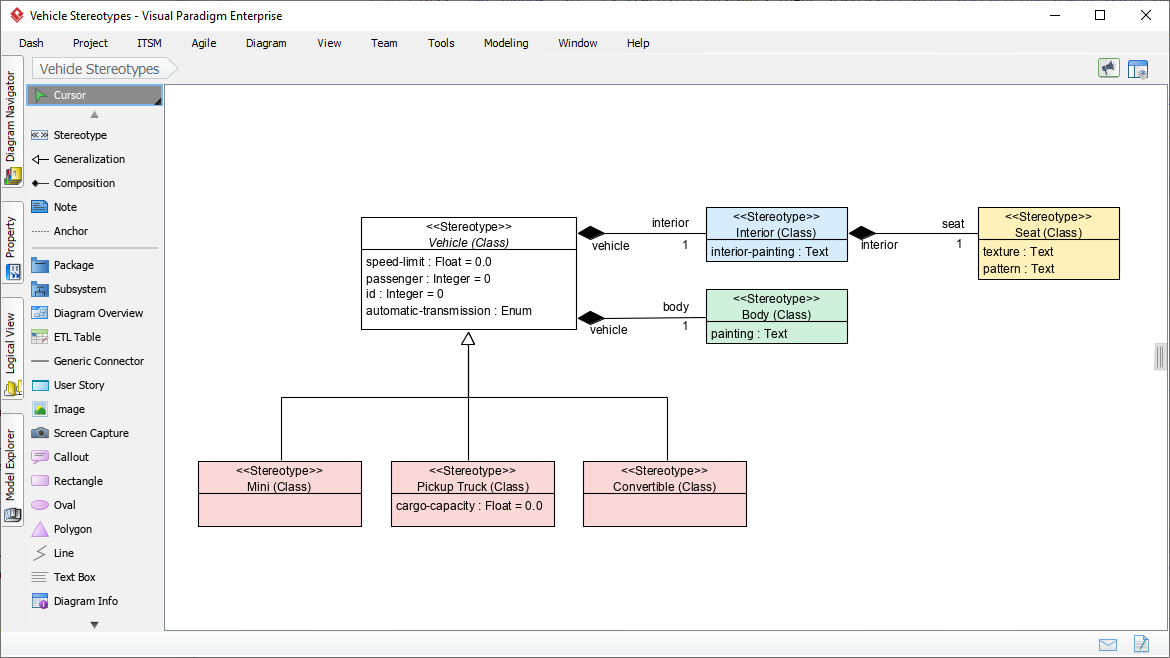

A UML profile can be created in 3 ways: by creating a new metamodel, extending the existing metamodel or using language-inherent mechanisms.
- Stereotypes allow you to increase the vocabulary of UML by creating new building blocks that look primitive and speak the language of your domain.
- Tagged values are used to add information to a UML model element. They can be used for code generation, version control, configuration management, authorship, etc.
- Constraints allow you to extend the semantics of UML building blocks by adding new protocols. They are rendered as string enclose in brackets placed near associated element.
Behavior Diagram
UML behavior diagrams visualize, specify, construct and document the dynamic aspects of a system. Behavior diagrams are categorized as follows: use case diagrams, interaction diagrams, state diagrams, and activity diagrams.
1. Use Case Diagram
A use case diagram is a visual representation of a software program’s behavior. It helps designers communicate the behavior of a system to the user by specifying externally visible system behavior. Use cases represent only the functional requirements of a system. Business rules, quality of service requirements, and implementation constraints must be represented separately. Use case diagrams are used to describe the roles of individuals in a system. They can be used to plan requirements, validate a hardware design, test a software product, or create an online help reference.
Use case modeling was introduced in 1986 by Ivar Jacobson. In 1992, his book Object-Oriented Software Engineering helped popularize the technique. A use case diagram is a higher-level view of a system. It is beneficial to write use cases at a coarser level of granularity with less detail when not required. Use case diagrams are typically developed in the early stage of development to capture requirements, validate architecture, and drive implementation.
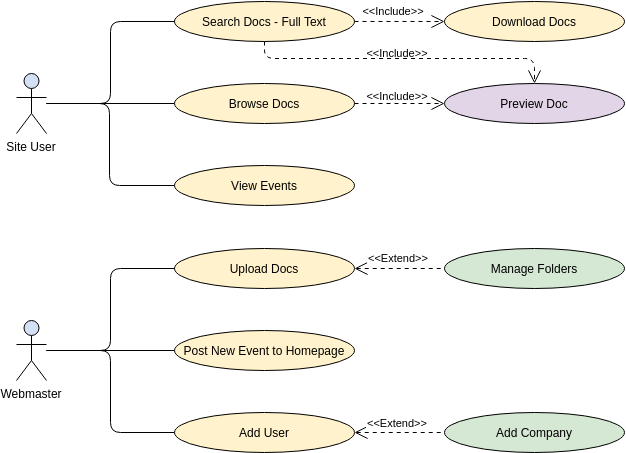
- Use case diagrams should be structured from the perspective of actors, and focus on the “what” and not the “how”.
- The extend relationship is used to include optional behavior from an extending use case in an extended use case.
- A generalization relationship connects two use cases. The child may add or override the behavior of the parent.
- The actors of your system are the people who use, install, start up, maintain, shut down and get information from and provide information to the system.
2. Activity Diagram
Activity Diagrams are used to depict the flow of control in a system and describe the steps involved in the execution of a use case. Activity diagrams are graphical representations of workflows, supporting choice, iteration and concurrency. They can also include elements showing the flow of data between activities. They are similar to flowcharts and are used to depict the dynamic aspects of a system. For example, an activity diagram can be use to show the flow of control from the initial state to the final state.
Activity diagrams are also used to model business processes and workflows. They are used to capture the dynamic behavior of a system and to model the workflow of an object-oriented or a distributed system.
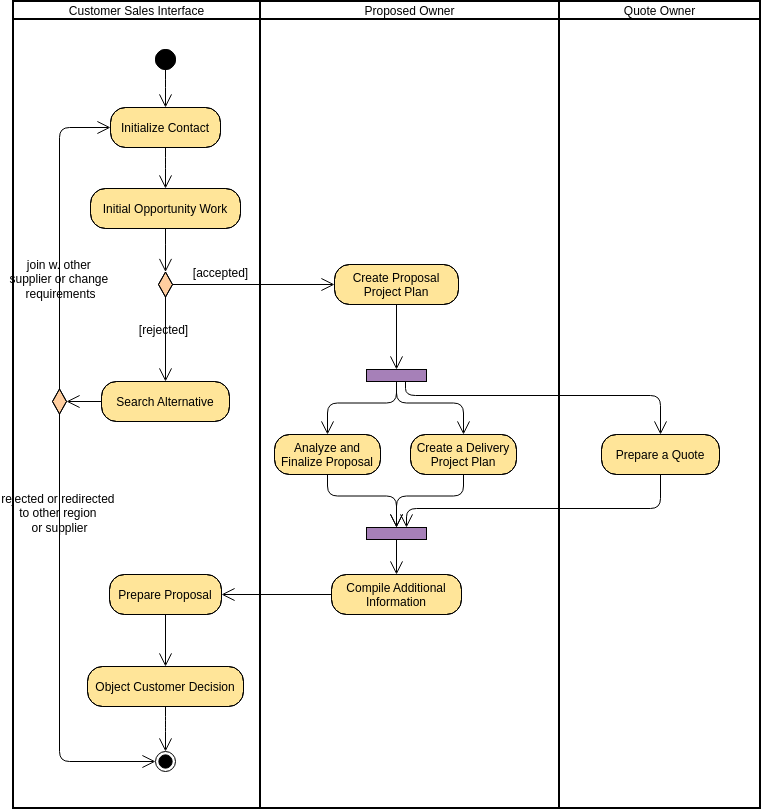
Edit this Activity Diagram Online
- Activity diagrams are used to model a series of actions or flow of control in a system.
- A diamond represents a decision with alternate paths. The alternates should be labeled with conditions.
- A fork node splits a single incoming flow into multiple concurrent flows.
- A join node joins multiple concurrent flows back together.
- Pins are used to clear up messy activity diagrams. They represent one input to or an output from an action.
- Signals are used to modify activities in a system. A response is needed before the activity can be modified.
- Swimlanes are used to group actions in activity diagrams.
3. Sequence Diagram
A sequence diagram is a simple diagram used to show interactions between parts (i.e. subsystem or objects) of a system. UML Sequence Diagrams show how objects interact in time by using the vertical axis to represent time. Sequence Diagrams capture interactions between a system and its user, or between systems. A sequence diagram shows how operations are carried out. The time progresses as you go down the page.
In a sequence diagram, messages represent the interaction between objects. Call messages represent a request to invoke an operation, Return messages represent information flow from the receiver to the caller, and Recursive messages represent a call to the caller.
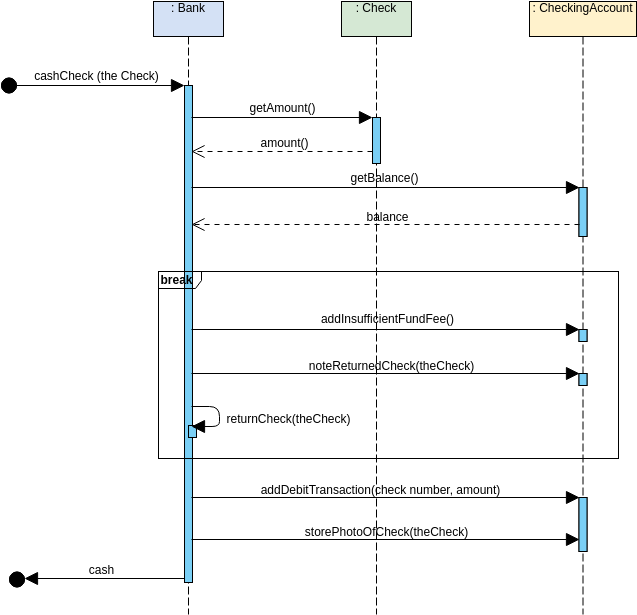
- A sequence diagram can be use to model how different parts of a system interact to carry out a single use case, for example a sequence diagram can help to visualize interactions among classes and discover responsibilities in a new system.
- In a sequence diagram, an object sends a message to another object. Both objects are active during the exchange of the message.
- Message Arrows are used in sequence diagrams to indicate a message. The message arrow comes with a description, known as a message signature, on it.
- An asynchronous message is sent when the message caller does not wait for the message to be processed.
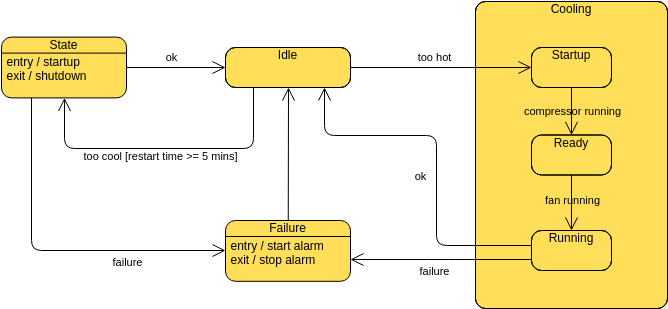
4. State Machine Diagram
A State Machine diagram (known as state chart, state transition diagram) is used to describe the different states of a component in a system. It is controlled by external or internal events. They are used to model the dynamic nature of a system. It describes the flow of control from one state to another state and is used to model the lifetime of an object from creation to termination. For example, state diagrams show all possible behaviours of objects of a class and the ordering of events, and are vital for our understanding of the system.
In most systems, complexity arises from interaction between objects of different classes, and so state diagrams are not necessary for every class. However, for complex classes, such as process control or communication systems, a state diagram is necessary to model the behaviour of the objects.

Edit this State Machine Diagram Online
- A black filled circle to represent the initial state of a System or a class.
- A solid arrow to represent a transition from one state to another
- A rounded rectangle to represent a state.
- State transitions from one state to another are effected by events.
- Guards prevent certain transitions from being passed-through, and internal transitions do not effect state transitions.
- A state diagram includes an initial state, middle states, transitions, and a final state. It also includes a box with rounded corners, a name, state variables, and actions performed in each state.
What is a State?
A state is a condition or situation during the life of an object, and an event is a stimulus that can trigger a state transition. A guard condition is an evaluation of a boolean expression, and a transition may have multiple guard conditions. State diagrams are often used to describe the behaviour of electronic components. State diagrams can include splitting states into multiple states, conjoining states, historical states and composite states.
Activity Diagram vs State Diagram
- In UML, Activity Diagrams represent high-level activities. In particular, Activity Diagrams can represent concurrency and coordination.
- In a State Machine Diagram, vertices represent states of an object, and edges represent occurrences of events. Additional notations capture how activities are coordinated.
5. Communication Diagram
Communication diagrams show how objects interact. They also show the messages that travel between objects. Model message passing between objects that deliver functionalities of use cases and operations, and capture interactions that show the passed messages. In a communication diagram, objects (actors in use cases) are represented by rectangles, and messages passed between objects are represented by labeled arrows that start with the sending object and end with the receiving object. It is easy to read because the messages are labeled with numbers.
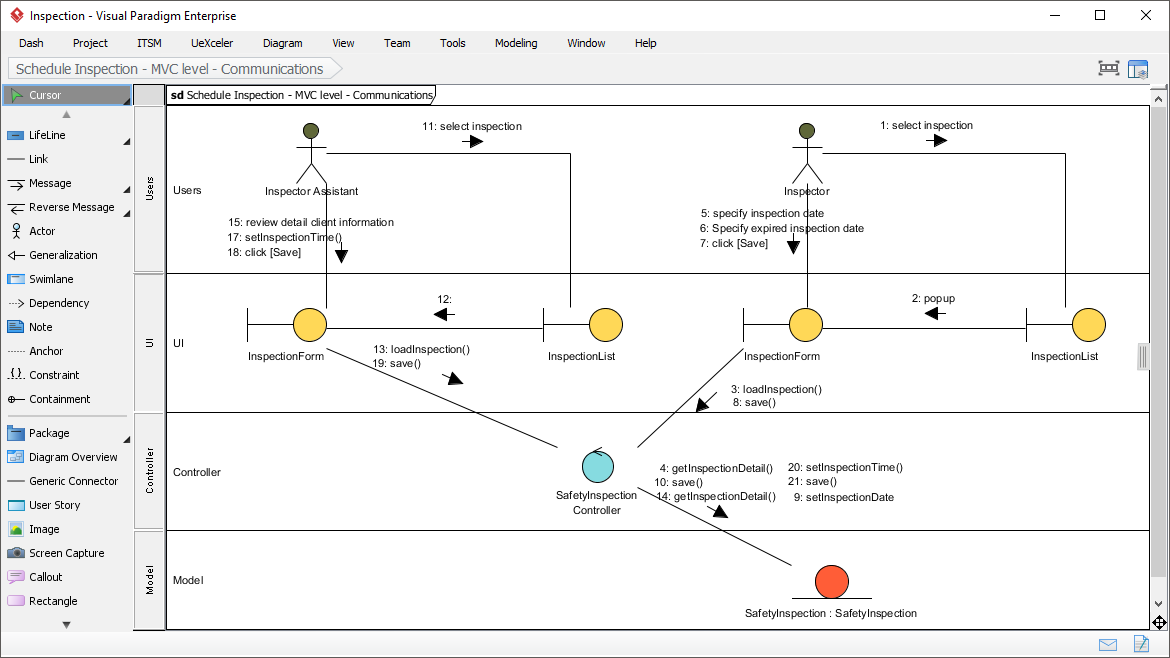
(Created with Visual Paradigm’s Communication Diagram tool)
- UML Communication Diagrams show how messages are sent and received between objects in a system or piece of software.
- Lines represent links, and arrows represent messages.
- Messages are numbered in sequential order and are described with numbers and decimal points.
Communication Diagram vs Sequence Diagram
The communication diagram and the sequence diagram are similar. They present the same information, but the communication diagram is arranged according to space, and the sequence diagram is arranged according to time.
For example, it often amalgamates both the activity and sequence diagrams and depicts the messages that are exchanged between the entities to achieve certain specified tasks in the system.
- The sequence diagram shows the time ordering of messages, and
- The communication diagram shows the relationships between objects.
6. Interaction Overview Diagram
Interaction overview diagrams are similar to activity diagrams, but each individual activity is depicted as a frame, which can contain a nested interaction diagram. UML interaction overview diagrams provide a high level of abstraction of the interaction model. They can also show the flow of activities between diagrams. In other words, interaction diagrams show the dynamic behavior of a system by describing the chronological order of messages and the structural organization of the objects that send and receive them.
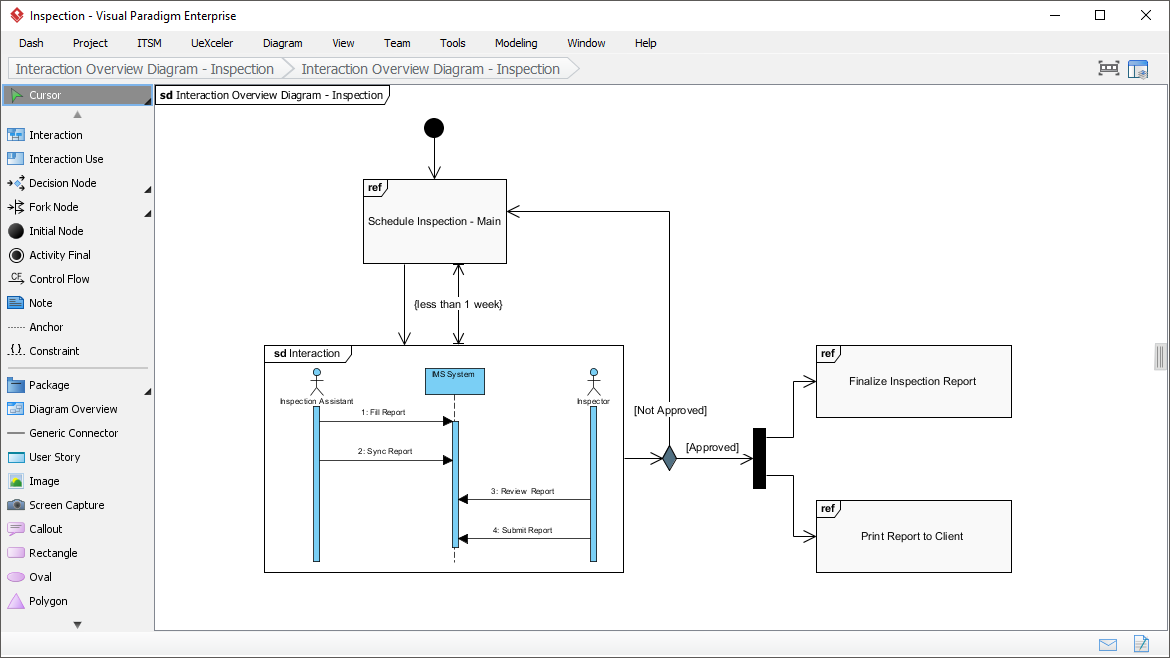
(Created with Visual Paradigm’s Interaction Overview Diagram tool)
An interaction overview diagram is similar to an activity diagram, but each individual activity is pictured as a frame which can contain a nested interaction diagram. UML Interaction Overview Diagrams provide a high level of abstraction of an interaction model. They can also show the flow of activity between diagrams. In other words, the interaction diagram shows the dynamic behavior of the system by describing the time sequence of messages and the structural organization of objects that send and receive messages.
An interaction overview diagram includes nodes that represent interaction diagrams. For example, an interaction occurrence (or reference sequence diagram) enables you to refer to another sequence diagram from within a sequence diagram. This functionality enables you to break down complex scenarios into smaller scenarios that can be reused. Each scenario is an “interaction.”
7. Timing Diagram
A time diagram is a part of an interaction diagram that depicts how conditions change within and between lifelines alongside a linear timeline. It shows how objects interact over a certain period of time, shows how long each step of the process takes, and can be used to find improvements.
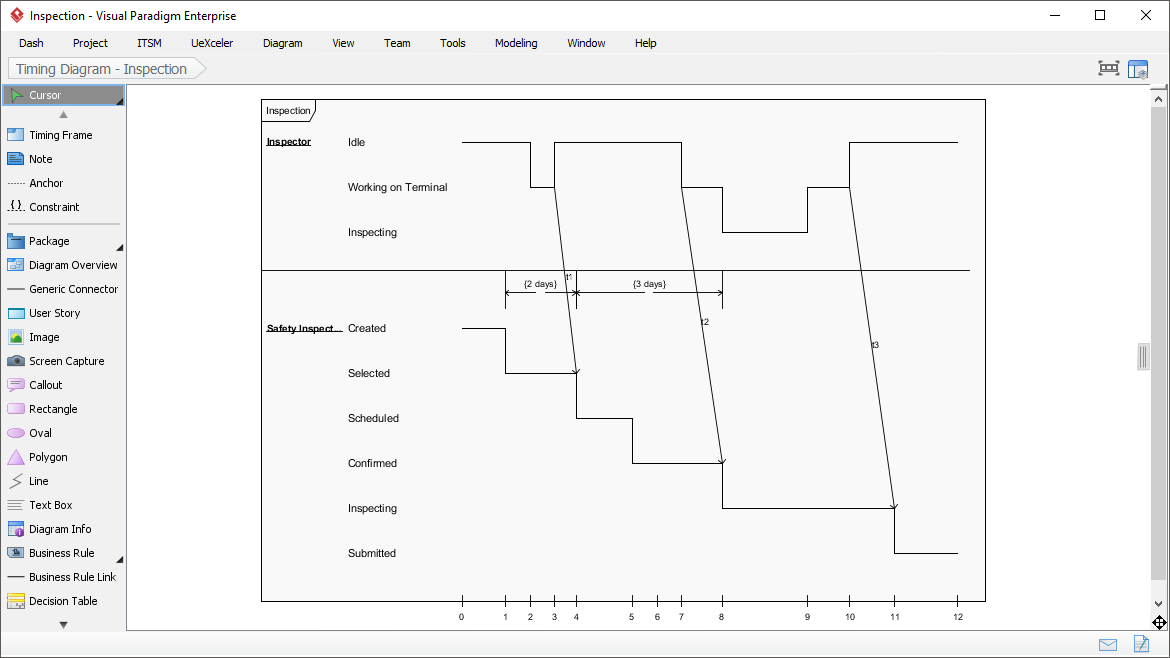
(Created with Visual Paradigm (Desktop)’s Timing Diagram editor)
- A timing diagram shows interactions along a linear time axis, and includes elements such as message, lifeline, timeline, and object or role.
- A lifeline represents an individual participant in an interaction. It could be placed inside a diagram frame or a swimlane.
- The duration constraint is used to determine if a constraint is satisfied for a duration or not.
- A time constraint is an interval constraint that represents a time interval. A violated time constraint means the system is failed.
UML Resources
This post is also available in Deutsche, Español, فارسی, Français, English, Bahasa Indonesia, 日本語, Polski, Portuguese, Ру́сский, Việt Nam, 简体中文 and 繁體中文.
