


Use the diagram editor grid
Using the editor grid when drawing the diagram can help you align shapes and connectors. This video can show you how to use the diagram editor grid in Visual Paradigm Online.
When editing your design, you can go to the Settings Panel, to turn on the display of the grid in the editor. You can also adjust the grid size, as well as its color.
By default, a grid with a size of 10pts in a light grey is displayed on the diagram canvas. And it is not included when you print the diagram or when you export it to an image format or a PDF file.
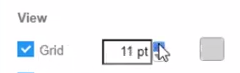
- Make sure nothing is selected in the chart so you can see the diagram tab in the Settings Panel.
- You can click on the Grid checkbox in the Diagram tab to display or hide the grid on the drawing canvas.

Set grid size
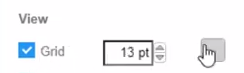
Enter a new size in the Grid text field in the Diagram tab, or use the up and down arrows to increase or decrease the size of the grid.
Set grid color
Click on the color button next to the Grid size field in the Diagram tab to change the grid’s color, then select a new color from the palette, or enter a color hex code to change the color.
This post is also available in Deutsche, Español, فارسی, Français, English, Bahasa Indonesia, 日本語, Polski, Portuguese, Ру́сский, Việt Nam, 简体中文 and 繁體中文.
