


What Are Flowcharts and How Can They Benefit Your Organization?
Flowcharts are an essential tool for visualizing processes and understanding complex workflows. They allow individuals to map out a process step-by-step, identify potential roadblocks or inefficiencies, and improve communication within an organization. In this article, we will explore the different types of flowcharts, including basic flowcharts, data flowcharts, swimlane flowcharts, workflow charts, and process maps. We will also discuss best practices for creating effective flowcharts, including the use of standard symbols, clear language, consistent formatting, logical organization, testing, and collaboration. By following these best practices, individuals can create flowcharts that accurately represent their processes and help improve efficiency and productivity within their organization.
The Elements of a Flowchart
Flowcharts are a powerful tool for visualizing complex processes and workflows in a clear and concise way. A flowchart breaks down a process into individual steps and illustrates the relationships and dependencies between them. To create an effective flowchart, there are several key elements that must be used. These include connectors, start/end points, processes, decisions, and input/output symbols. In the following paragraphs, we will provide a brief description of each of these elements, their purpose, and their typical representation in a flowchart.
- Start/End: This component indicates the beginning and end of a process. It is usually represented by a circle or oval shape.
- Process: This component represents a specific action or task that needs to be performed. It is usually represented by a rectangle or square shape.
- Decision: This component represents a choice or decision point in the process. It is usually represented by a diamond shape.
- Input/Output: This component represents the input or output of data or information. It is usually represented by a parallelogram shape. Connector: This component is used to connect two or more components that are not in a sequential order.
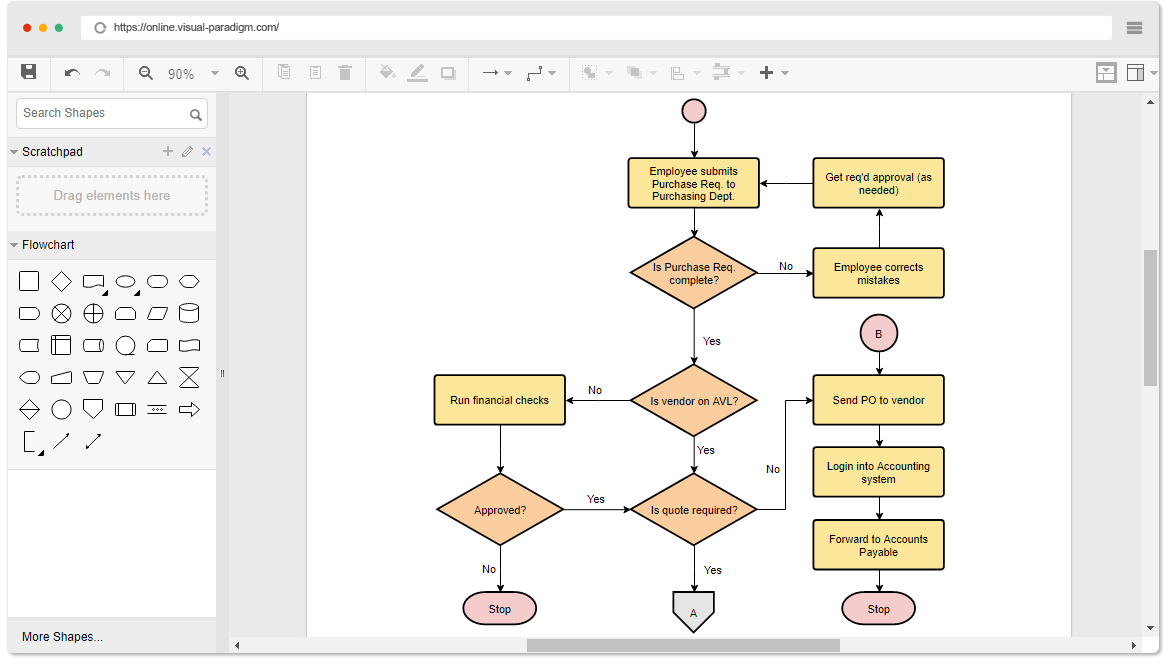
Online Flowchart Software that is User-Friendly and Intuitive
Visual Paradigm Online is a comprehensive and intuitive diagramming tool that offers a range of features and benefits for creating flowcharts. Here are some reasons why you might choose Visual Paradigm Online for your flowchart design:
- Ease of use: Visual Paradigm Online offers an intuitive interface and drag-and-drop functionality that makes it easy to create and customize flowcharts quickly and efficiently.
- Collaborative features: Visual Paradigm Online enables multiple users to work on the same diagram simultaneously, making it ideal for team-based projects and collaborations.
- Comprehensive library of symbols and templates: Visual Paradigm Online provides a wide variety of pre-built symbols and templates that can be used to create professional-looking flowcharts with ease.
- Cloud-based platform: Visual Paradigm Online is a cloud-based platform, which means that you can access your diagrams from anywhere with an internet connection. This makes it ideal for remote work, as well as collaborations across different locations.
Visual Paradigm Online is a versatile and user-friendly tool that offers a range of features and benefits for creating high-quality flowcharts. Whether you are working on a team-based project or need to create diagrams quickly and efficiently, Visual Paradigm Online can help streamline your workflow and simplify the process of diagram creation.
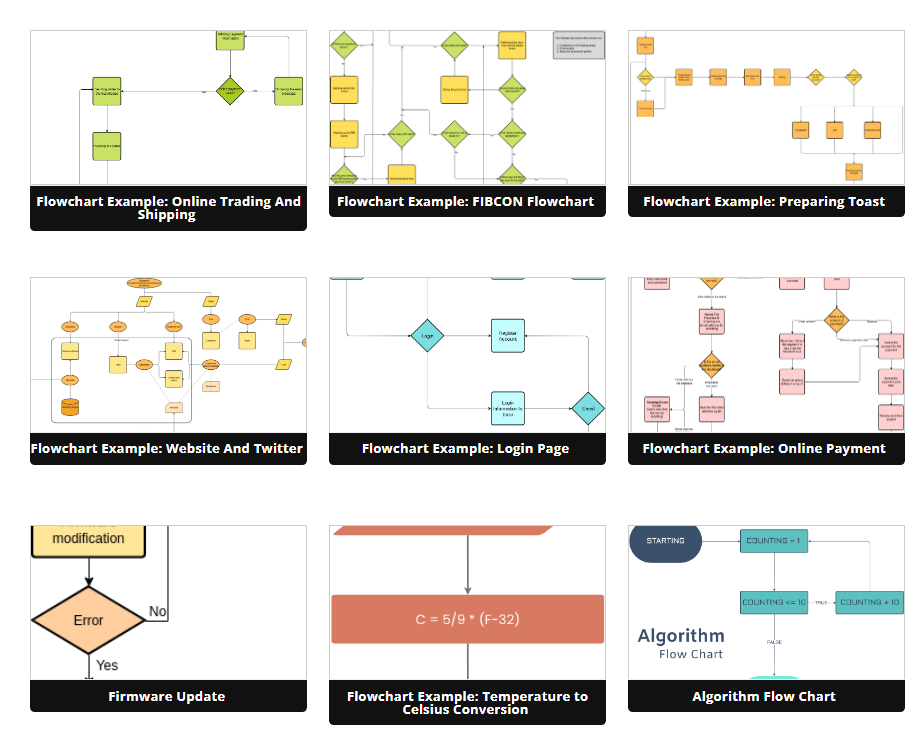
Exploring Flowcharts with Visual Paradigm Online: Wide Variety of Examples
If you are interested in learning about flowcharts or want to explore the different types of flowcharts and their applications, Visual Paradigm can be an excellent resource. Visual Paradigm provides a wide variety of flowchart examples that can help you understand the different types of flowcharts and their practical uses. For example, you can find examples of process flowcharts, data flow diagrams, swimlane flowcharts, workflow diagrams, and value stream maps, among others. These examples can be used to understand the symbols, conventions, and best practices for creating effective flowcharts, as well as the specific applications of each type of flowchart.
Additionally, Visual Paradigm’s online diagramming tool is user-friendly and intuitive, making it easy to create your own flowcharts and collaborate with others in real-time. Whether you are a beginner or an experienced professional, Visual Paradigm’s examples can provide valuable insights into the world of flowcharting and help you create high-quality diagrams for your projects.
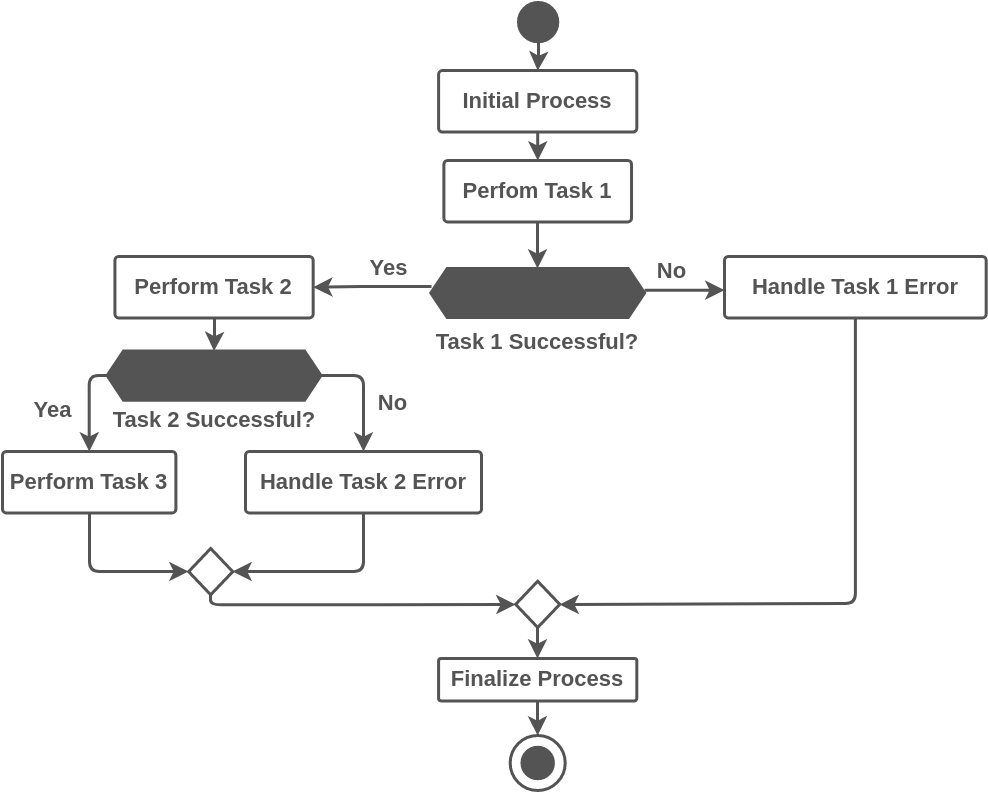
Flowchart a Generate Example
Problem Description: This is a simple process flowchart that represents a three-step process. The flowchart starts at the “Main” block with the “start” symbol, indicating the start of the process. The process then moves to the “Initialize process” block, followed by “Perform Task 1”. The flowchart then uses a decision diamond to determine if Task 1 was successful. If Task 1 was successful, the flowchart proceeds to “Perform Task 2”. If Task 2 is successful, the process continues to “Perform Task 3”. If Task 2 fails, the process moves to “Handle Task 2 Error”. If Task 1 fails, the process moves to “Handle Task 1 Error”. Finally, the flowchart ends with “Finalize process” and “stop” symbols.
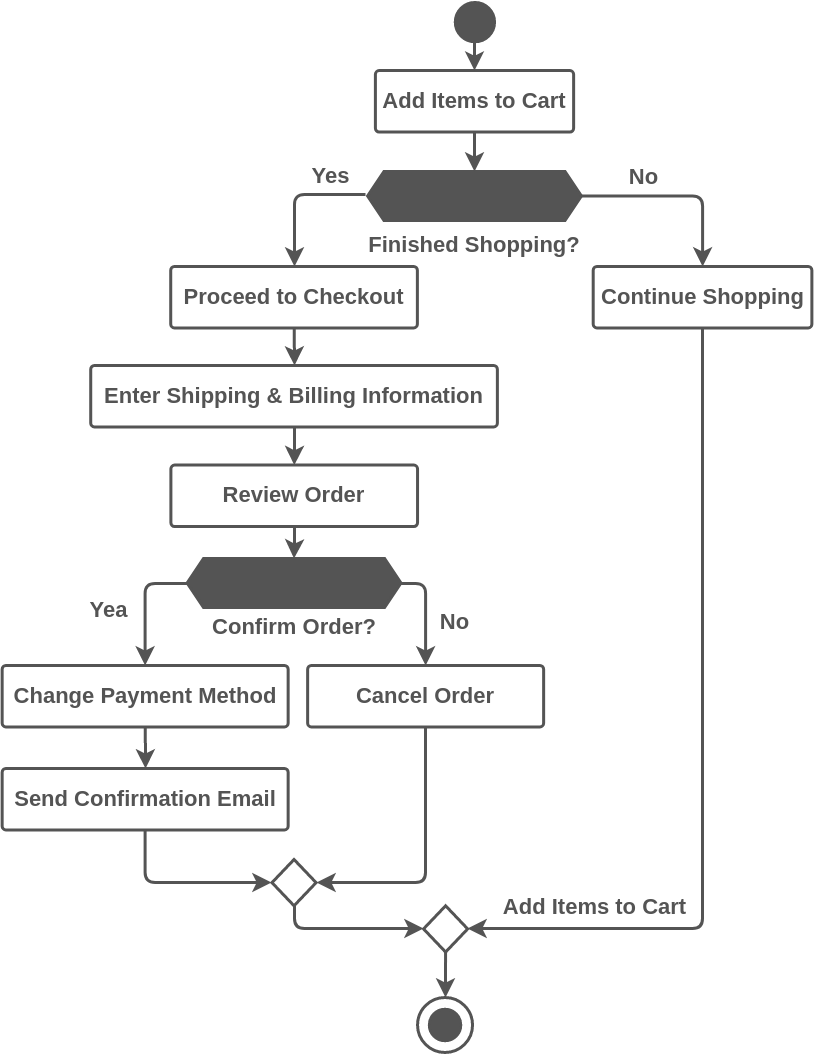
Flowchart Example – Place Order
The following flowchart represents the process of placing an order in an online shop. The process starts with the user adding items to their cart. If the user is finished shopping, they proceed to the checkout process. During checkout, the user enters their shipping and billing information, and then reviews their order. If the user confirms the order, the online shop charges the user’s payment method and sends a confirmation email. If the user cancels the order, the process ends.
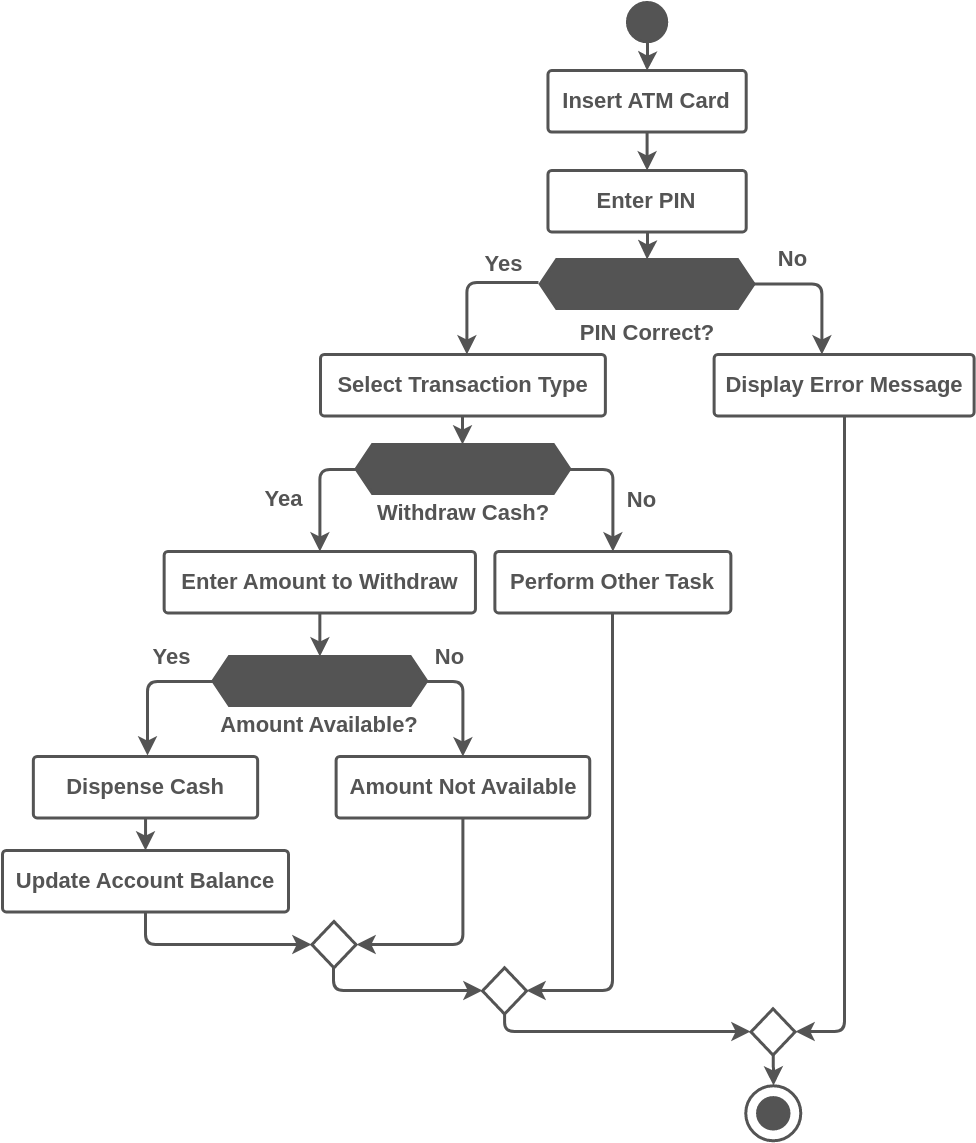
Flowchart Example – Withdraw Cash (ATM Systems)
Description: The following flowchart represents the process of withdrawing cash from an ATM. The user inserts their ATM card and enters their PIN. If the PIN is correct, the user is presented with options for withdrawing cash, checking their account balance, or performing other tasks. If the user selects the “Withdraw Cash” option, they are prompted to enter the desired amount. If the amount is available, the ATM dispenses the cash and updates the user’s account balance. If the amount is not available or the user cancels the transaction, the process ends.
Structured Breakdown of the ATM Cash Withdrawal Process
The purpose of the structured text above is to provide a clear and organized breakdown of the problem description, goals, inputs, outputs, and process involved in withdrawing cash from an ATM. This makes it easier to understand the problem and what needs to be accomplished in order to create a solution (i.e. a flowchart). Breaking down the information into bullet points helps to make it more readable and digestible, and can also help to ensure that no important details are left out.
here’s the problem description broken down into bullet points:
- Problem: The process of withdrawing cash from an ATM needs to be defined.
- Goal: To create a flowchart that outlines the process of withdrawing cash from an ATM.
- Inputs: The user’s ATM card, the user’s PIN, the desired amount of cash to withdraw.
- Outputs: Dispensed cash, updated account balance.
- Process:
- User inserts ATM card.
- User enters PIN.
- System checks if PIN is correct.
- If PIN is correct:
- System presents options for transaction types.
- If user selects “Withdraw Cash”:
- User enters desired amount of cash to withdraw.
- System checks if amount is available.
- If amount is available:
- System dispenses cash.
- System updates user’s account balance.
- If amount is not available:
- System displays “Amount not available” message.
- If user selects another transaction type:
- System prompts user to perform that transaction.
- If PIN is not correct:
- System displays “Incorrect PIN” message.
- End result: A flowchart that represents the process of withdrawing cash from an ATM, which can be used to inform system design and user training.
Creating a Flowchart Based on the Structured Breakdown of the ATM Cash Withdrawal Process
Now that we have a structured breakdown of the ATM cash withdrawal process, creating a flowchart becomes much easier. By breaking down the problem into clear and organized bullet points, we have a better understanding of the inputs, outputs, and steps involved in the process. This makes it easier to create a visual representation of the process using a flowchart. With this approach, we can quickly and easily create a clear and concise flowchart that accurately represents the ATM cash withdrawal process. By following the structured breakdown we have created, we can ensure that our flowchart is comprehensive and accurate, making it an effective tool for system design and user training.
Conclusion
Flowcharts are an effective tool for visualizing and representing complex processes and decision-making workflows. They are used in various fields such as software development, engineering, and business analysis to simplify and communicate ideas in a clear and concise manner. By using standard symbols and diagrams, flowcharts make it easy to understand the logic behind a process and identify potential bottlenecks or inefficiencies. They can also help identify areas for improvement and optimization. Whether you are a programmer, engineer, or business analyst, learning how to create and use flowcharts can greatly improve your ability to analyze and communicate complex ideas.
This post is also available in Deutsche, Español, فارسی, Français, English, Bahasa Indonesia, 日本語, Polski, Portuguese, Ру́сский, Việt Nam, 简体中文 and 繁體中文.
