Home » Archives for September 2021 » Page 7
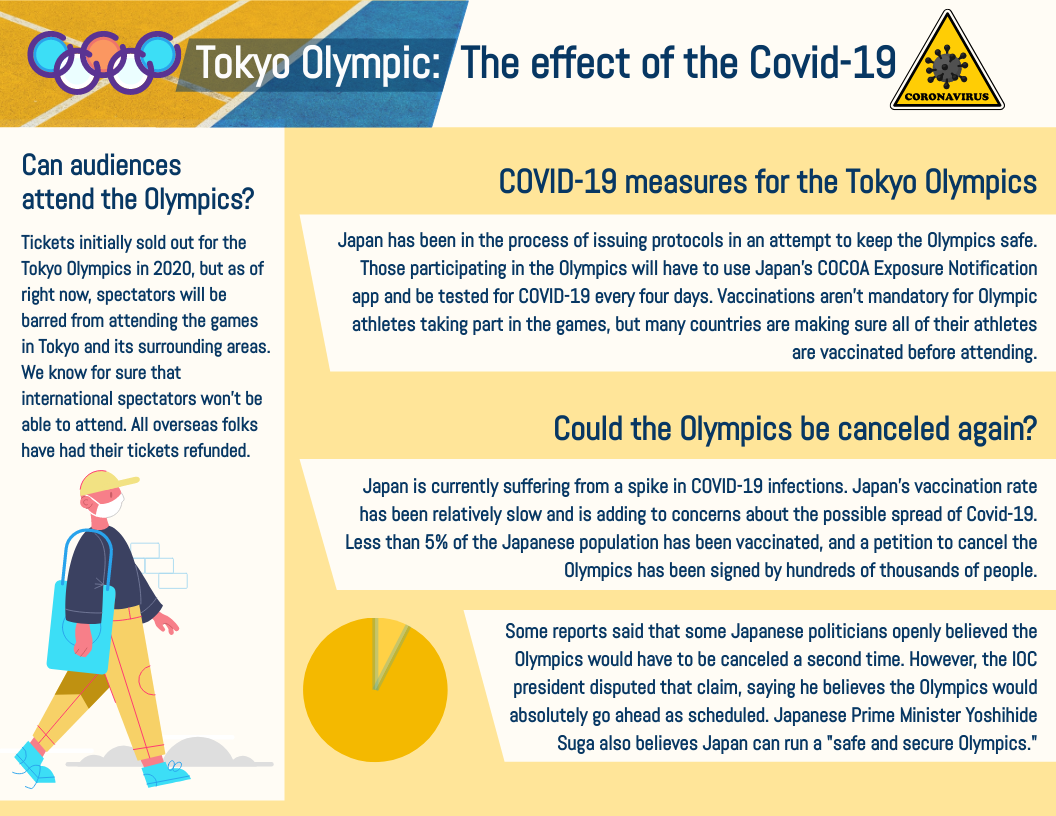
Introducing the Tokyo Olympic Covid-19 Infographic, a visually stunning and informative graphic that highlights the impact of the pandemic on the 2021 Olympic Games in Tokyo. This infographic showcases the effects of Covid-19 on various aspects of the Olympics, such as the number of athletes and countries participating, and the measures taken to ensure the safety of everyone involved. The design is clean, modern, and easy to read, with an emphasis on using colors and icons to convey information quickly and effectively. Customize this Infographic Template To create a high-quality infographic like this…
continue reading →
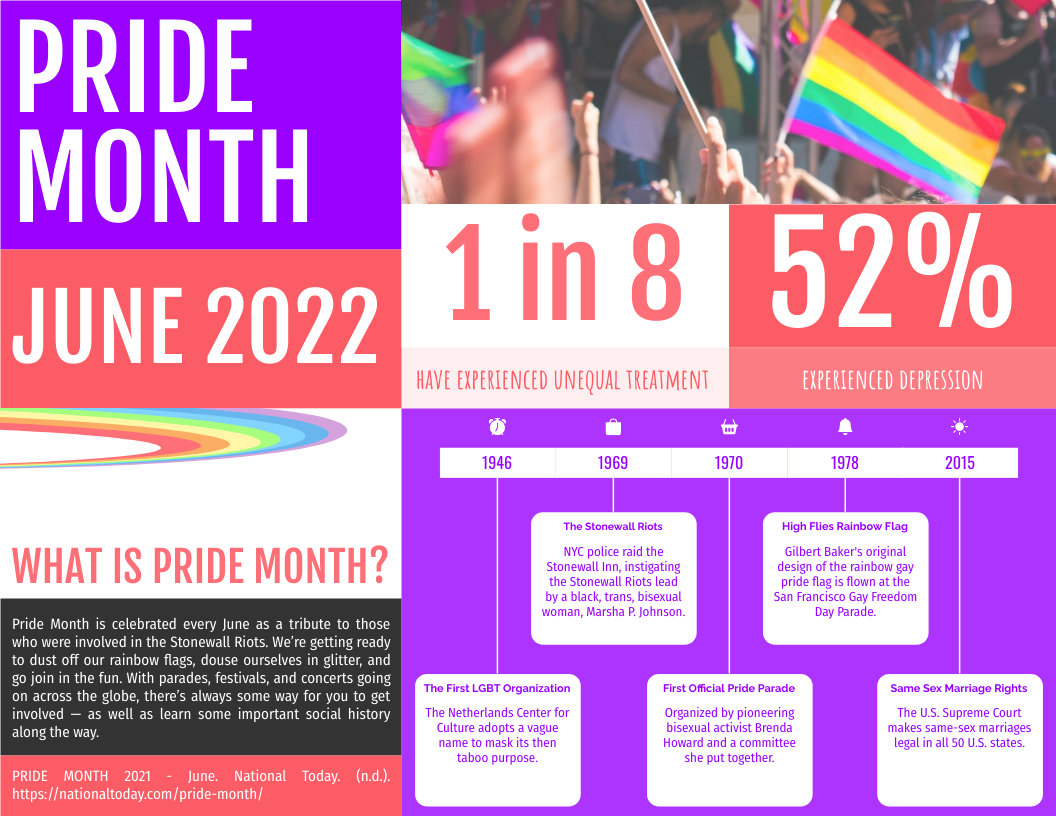
The "History Of Pride Month Horizontal Infographic" is a vibrant and engaging design that outlines the important milestones and events that have shaped Pride Month throughout history. The infographic features colorful graphics and eye-catching icons that illustrate the significant moments in the LGBTQ+ community's journey towards equality and acceptance. Customize this Infographic Template Using Visual Paradigm Online's powerful graphic design tools, users can create high-quality infographics like this one quickly and easily. With a wide range of customizable templates and design elements, Visual Paradigm Online makes it simple to create visually stunning and…
continue reading →
Introducing the Tokyo Olympics 2021 Infographic, a stunning and informative design that captures the excitement and significance of this global event. With its vibrant colors and engaging visuals, this infographic is the perfect tool for businesses and organizations looking to showcase their support for the Olympics or simply inform their audience about this historic event. Customize this Infographic Template Created using Visual Paradigm Online, a powerful online infographic maker and graphic design tool, this infographic stands out for its high-quality and fully customizable design. Using Visual Paradigm Online's intuitive drag-and-drop interface, you can…
continue reading →
Introducing our latest infographic created with Visual Paradigm Online - "The Benefits of Mobile App for Business Infographic". This eye-catching and informative design showcases the advantages of mobile apps for businesses and organizations. The design features a bright and bold color scheme with modern illustrations and typography to capture the audience's attention. Customize this Infographic Template At Visual Paradigm Online, we pride ourselves on providing a user-friendly and efficient online infographic maker that helps you create high-quality infographics. Our online infographic tool enables you to customize our templates, add your content and create…
continue reading →
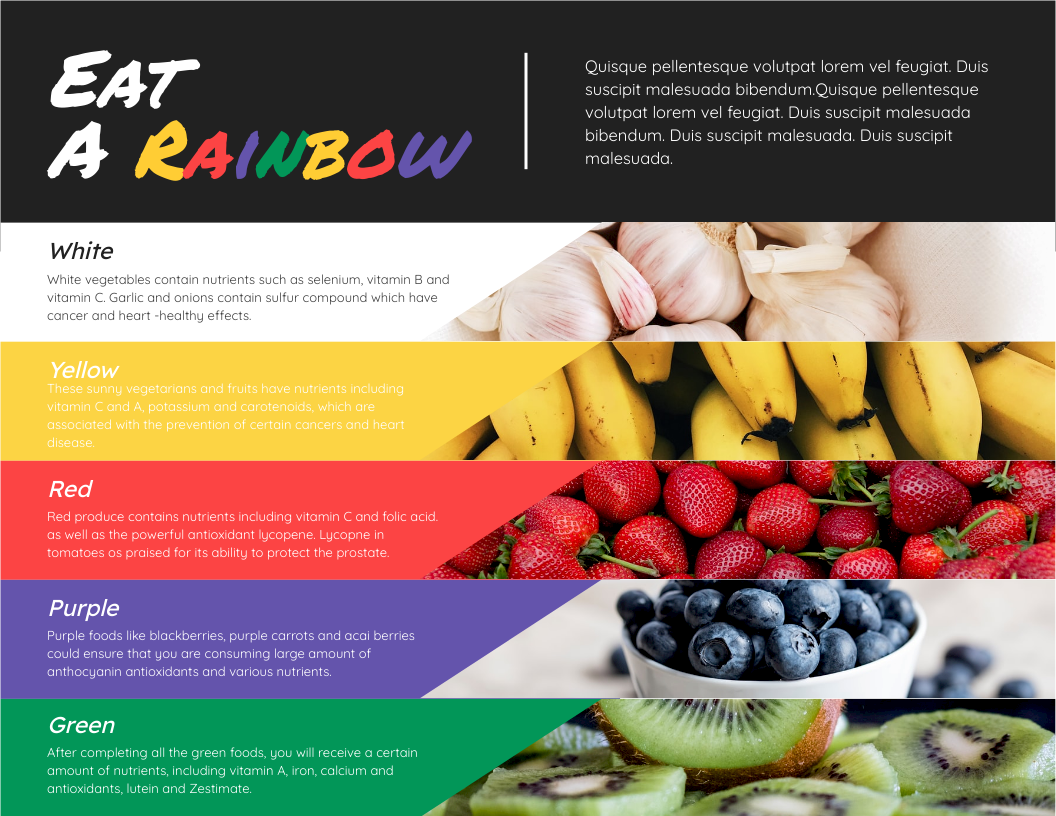
Are you looking to create a stunning infographic that grabs the attention of your audience? Look no further than Visual Paradigm Online! With our easy-to-use online infographic maker, you can create high-quality, fully customizable designs that are perfect for businesses and organizations. One popular theme for infographics is the "Eat A Rainbow Infographic", which showcases the importance of eating a variety of colorful fruits and vegetables. Our design features a vibrant color scheme and engaging icons that make the information easy to digest. Customize this Infographic Template At Visual Paradigm Online, we pride…
continue reading →
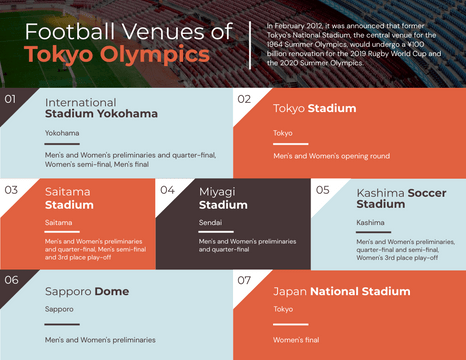
Are you looking for a visually stunning and informative infographic about the Football Venues of Tokyo Olympics? Look no further than Visual Paradigm Online's online infographic maker! Our customizable design is perfect for businesses and organizations seeking a high-quality infographic that can be tailored to their specific needs. Our infographic template showcases the most iconic football venues of the Tokyo Olympics, providing viewers with a comprehensive overview of each location. The design features bold and vibrant colors, making it easy for readers to navigate and comprehend the information presented. From the Ajinomoto Stadium…
continue reading →
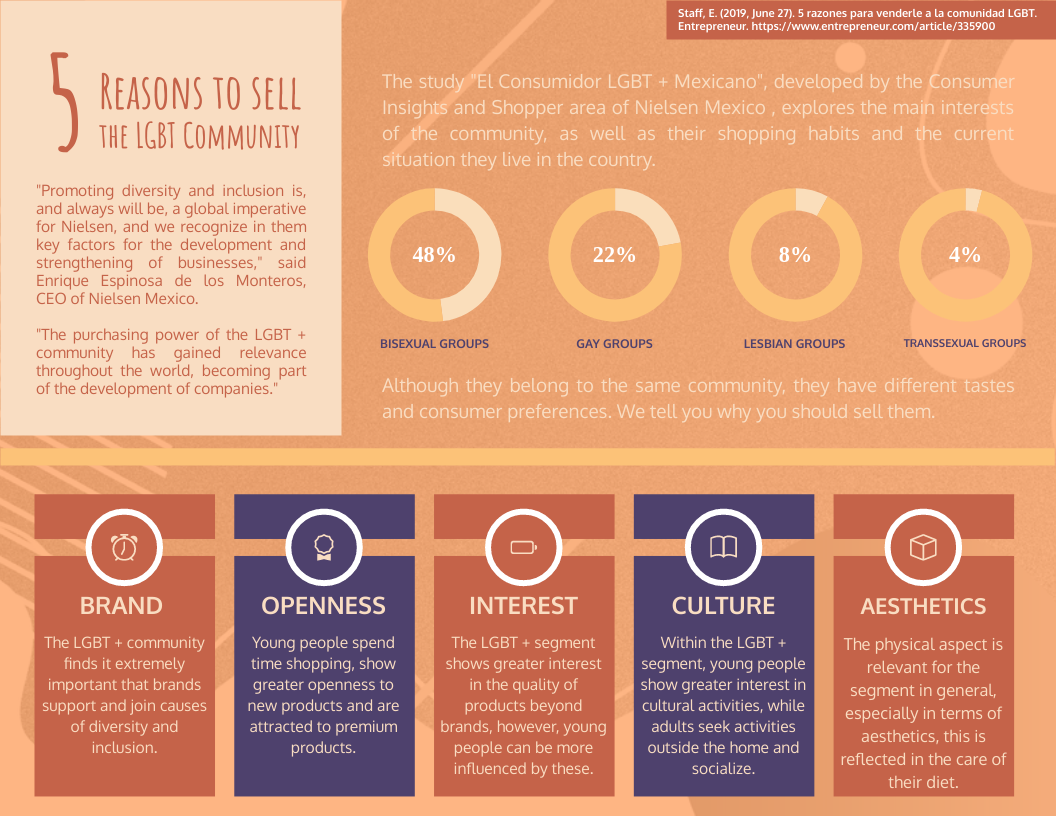
Introducing the "5 Reasons To Sell To The LGBT Community Infographic," created with Visual Paradigm Online's online infographic maker. This infographic aims to educate businesses and organizations on the importance of selling to the LGBT community and showcases five compelling reasons why it is a lucrative market. Customize this Infographic Template Visual Paradigm Online's infographic tool enables anyone to create a professional and visually stunning infographic like this one, even without any prior design experience. The software offers a vast range of design elements and graphics that can be fully customized to suit…
continue reading →
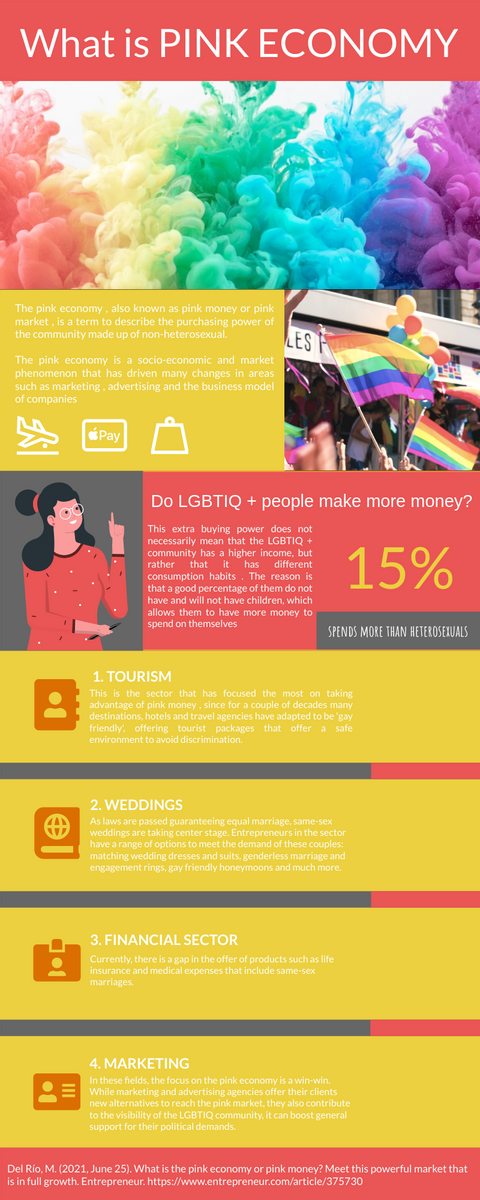
Welcome to our Introduction to Pink Economy Infographic, a powerful tool designed to help businesses and organizations understand the potential of the Pink Economy. The Pink Economy refers to the LGBTQ+ community and the significant economic impact they have on businesses and markets worldwide. Our infographic is visually appealing, easy to read, and fully customizable to meet your specific needs. Our design team used Visual Paradigm Online to create this high-quality infographic. Visual Paradigm Online is a user-friendly online infographic maker that allows you to create professional-looking infographics quickly and easily. With Visual…
continue reading →
Introducing "The 3 Learning Styles Infographic", designed with Visual Paradigm Online's powerful online infographic maker. This visually stunning and customizable infographic is perfect for businesses and organizations looking to enhance their learning and development strategies. The infographic features three distinct learning styles, including visual, auditory, and kinesthetic. Each learning style is accompanied by engaging visuals, detailed descriptions, and practical examples, making it easy to understand and apply. The color scheme and design elements used are modern and clean, ensuring that the information is easy to read and visually appealing. Customize this Infographic Template…
continue reading →
Looking for a customizable infographic design to showcase your travel data? Look no further than Visual Paradigm Online's "The Best Time to Go Travel Infographic"! This visually stunning and informative design is the perfect way to share your travel data with businesses, organizations, or anyone interested in exploring the world. Customize this Infographic Template Our online infographic maker allows you to create high-quality infographics like this one with ease. With Visual Paradigm Online's user-friendly interface and a wide variety of customizable templates, you can quickly and easily create an infographic that is tailored…
continue reading →

