


6 Ways to make your infographic more attractive
Infographics are a powerful visual tool for presenting complex information in a visually appealing and easily understandable format. However, not all infographics are created equal, and creating an attractive infographic that captures the attention of your audience requires careful consideration of various design elements.
In this article, we will explore six effective ways to make your infographic more attractive, from choosing the right colors and fonts to incorporating eye-catching visuals and ensuring a clear and logical flow of information. These tips will help you create infographics that are not only visually appealing but also engaging and effective in conveying your message. So, let’s dive in and learn how to make your infographics stand out!
Understanding your audience
Understanding your audience
Creating an amazing infographic starts with understanding your audience! Know your ideal audience’s age, gender, and culture, and you’ll have the perfect recipe for an infographic that resonates with them. Choose the right tones, colors, and visual effects to create an infographic that caters to their needs and preferences.
For example, check out this Children Playground Safety Infographic! It’s designed with vibrant colors, engaging illustrations, and a visual layout that’s perfect for educating young children.

Children Playground Safety Infographic
Edit this template
Infographics can also target specific groups, like office workers. Take a look at this simple and comprehensive visualization that office workers will love!

Ways To Reduce Stress Infographic
Edit this template
Catchy headings
Get your infographic off to a great start with a catchy heading that sets the theme and grabs attention! A powerful title can make all the difference in the success of your infographic. When people see an intriguing title, their curiosity is piqued, and they’ll be eager to learn more.
Take a look at this example: “Introduction Of Honey Infographic” It’s attention-grabbing and instantly communicates the topic: Honey for Everyone!
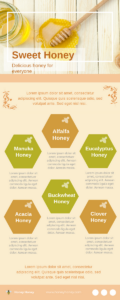
Introduction Of Honey Infographic
Edit this template
Simple
Keep it simple, yet effective! While infographics can explain complex concepts, it’s important to remember that simplicity is key. Don’t overwhelm your audience with too many elements or a busy design that distracts from the main points. Use plenty of white space, let your parts breathe, and keep it easy to read.
Here are some tips for you:
- Use lots of blanks to create a clean and uncluttered look.
- Keep important areas clear and prominent.
- A simple infographic is easier to understand and remember
Graphical
Make your infographic visually appealing with graphics that enhance the data! Illustrations can add life and interest to your infographic, making it more engaging and memorable.

9 Tips to Stay Productive When Work from Home Infographic
Edit this template
Try using relevant research data graphs like bar charts or pie charts with added numbers for visual impact. They’re eye-catching and allow for quick understanding of the differences between values. A picture is worth a thousand words, and a graphical infographic can truly bring your data to life!
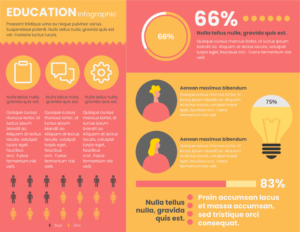
This template also has use graphics to represent values: Education Department Horizontal Infographic
Edit this template
Good storytelling
Tell a captivating story with your infographic! Infographics are a powerful storytelling medium that can guide your audience through information effectively. Use white space, text levels, color contrast, and charts to create a seamless flow of information.
Great infographics tell great stories! Start with a brief summary at the beginning to explain why the topic is important and what the infographic will cover. Use storytelling techniques to create an infographic that resonates with your audience and stays with them over time.
Information visualization
Visualize your data for maximum impact! Information visualization is the art of representing data or information visually, and it’s a powerful tool for creating engaging infographics.
Don’t be afraid to get creative and use information visualization skills to convey abstract information in an intuitive way. Say goodbye to boring data and hello to captivating infographics! Try using the VP Online infographic template to create clear, attractive, and visually stunning infographics with ease!
This post is also available in Deutsche, Español, فارسی, Français, English, Bahasa Indonesia, 日本語, Polski, Portuguese, Ру́сский, Việt Nam, 简体中文 and 繁體中文.
