


Beginner’s Guide to Data Flow Diagrams (DFD) with Visual Paradigm Online
Introduction
Data Flow Diagrams (DFD) are a powerful visual tool for representing and analyzing the flow of data within a system or process. They help in understanding how data moves through different components and processes, making it easier to identify bottlenecks, inefficiencies, and opportunities for improvement. In this beginner’s guide, we will introduce you to Data Flow Diagrams and show you how to create them using Visual Paradigm Online, a versatile diagramming tool with a large collection of templates.
What is a Data Flow Diagram (DFD)?
A Data Flow Diagram is a graphical representation of how data is processed within a system. It illustrates the movement of data between various processes, data stores, and external entities. DFDs use standardized symbols to depict the flow of data and the transformations it undergoes as it moves through a system.
Key Components of a DFD:
- Processes: These are the actions or activities that manipulate data. Each process is represented as a rectangular box in a DFD.
- Data Stores: Data stores represent where data is stored within the system. They are typically depicted as open-ended rectangles.
- Data Flows: Data flows are arrows that show the movement of data between processes, data stores, and external entities. They indicate the direction of data flow.
- External Entities: External entities are sources or destinations of data that interact with the system. They are represented as rectangles with rounded corners.
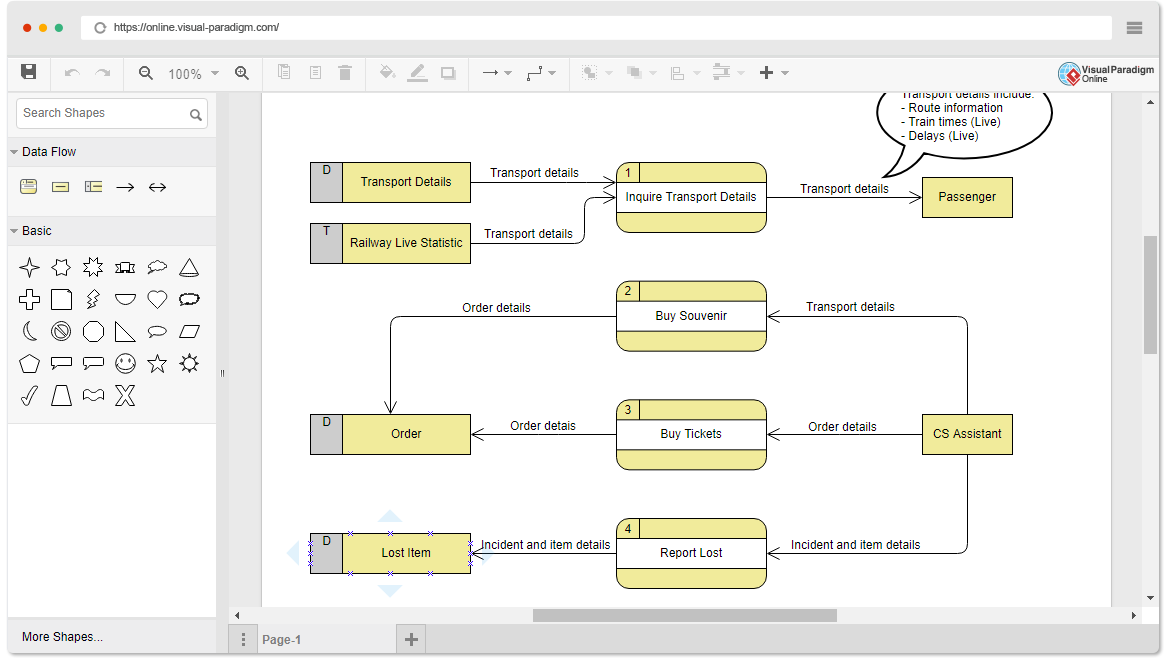
How to Create a Data Flow Diagram with Visual Paradigm Online
Visual Paradigm Online is a user-friendly online diagramming tool that offers a large collection of templates, including DFD templates, to help you get started quickly.
Step 1: Sign Up or Log In
- Go to the Visual Paradigm Online website.
- Sign up for a new account or log in if you already have one.
Step 2: Create a New DFD Diagram
- Once you’re logged in, click the “Create New” button.
- Select “Data Flow Diagram” from the diagram category.
Step 3: Add Components
- Start by adding processes, data stores, and external entities to your DFD by dragging and dropping them from the toolbox onto the canvas.
- Connect these components using data flow arrows to represent the flow of data between them.
Step 4: Define Processes and Data
- Double-click on a process to give it a meaningful name and describe its function.
- Similarly, double-click on data stores to name them and describe the data they hold.
Step 5: Refine and Organize
- Arrange your DFD components in a logical and organized manner to make the diagram more comprehensible.
- Use color coding or additional labels to enhance clarity if necessary.
Step 6: Save and Share
- Save your DFD diagram in Visual Paradigm Online.
- Share it with colleagues or collaborators by generating a shareable link or exporting it in various formats.
Learn by Examples with Visual Paradigm Online Templates
Visual Paradigm Online provides a wide range of DFD templates for various industries and use cases. Learning by examples is a great way to understand how to create effective DFDs. Here’s how you can use templates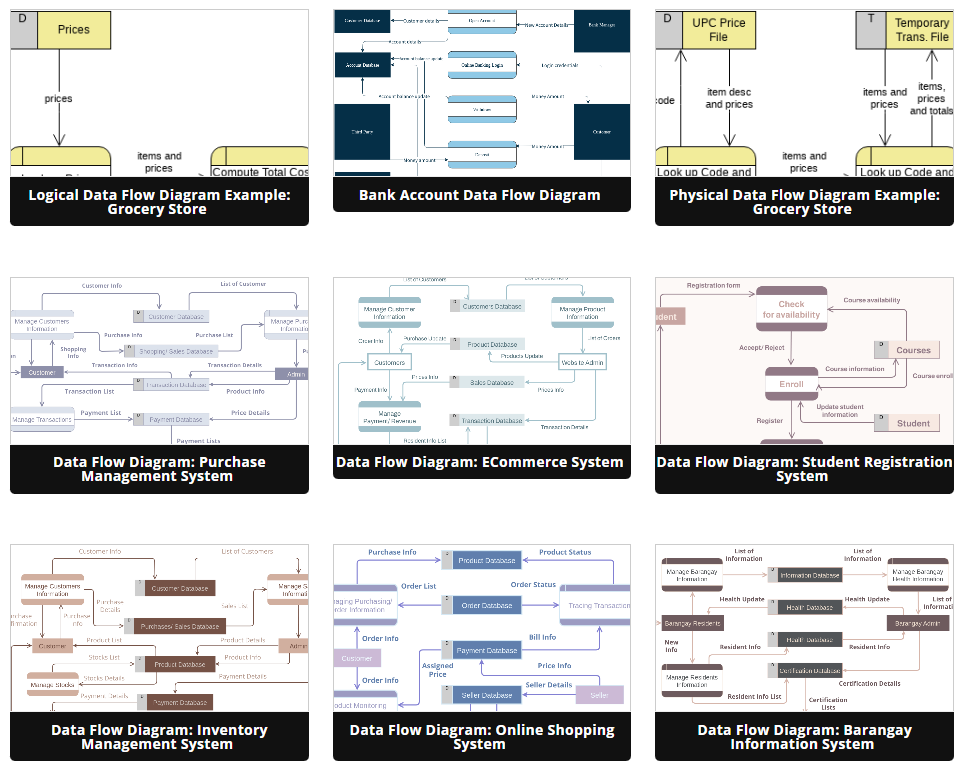
- In Visual Paradigm Online, click the “Template Gallery” button.
- Browse through the DFD templates available, and select one that matches your project or learning needs.
- Click on a template to open it.
- You can modify the template to fit your specific requirements or use it as a reference to create your own DFDs.
Conclusion
Data Flow Diagrams are invaluable tools for understanding and improving the flow of data within a system. Visual Paradigm Online simplifies the process of creating DFDs, and its extensive template library allows you to learn by example and start diagramming efficiently. Whether you’re a beginner or an experienced professional, mastering DFDs can greatly enhance your ability to analyze and optimize systems and processes.
This post is also available in Deutsche, Español, فارسی, Français, English, Bahasa Indonesia, 日本語, Polski, Portuguese, Ру́сский, Việt Nam, 简体中文 and 繁體中文.
