


Beginner’s Guide to Gane-Sarson Data Flow Diagrams
Introduction
Data flow diagrams (DFDs) are a powerful tool for visualizing and understanding how data moves within a business information system. They help analysts and designers to model processes, data stores, data flows, and external entities in a clear and structured way. Gane-Sarson notation, introduced by Chris Gane and Trish Sarson, is a widely used notation for creating data flow diagrams. In this beginner’s guide, we’ll introduce you to the basics of Gane-Sarson DFDs and show you how to learn by examples using the extensive collection of templates available in Visual Paradigm Online.
What is Gane-Sarson Notation?
Gane-Sarson notation is a standardized way of representing data flow diagrams. It provides a clear and consistent visual language to describe how data moves within a system. This notation is particularly useful for analyzing and designing information systems, making it an essential tool for business analysts, system designers, and software developers.
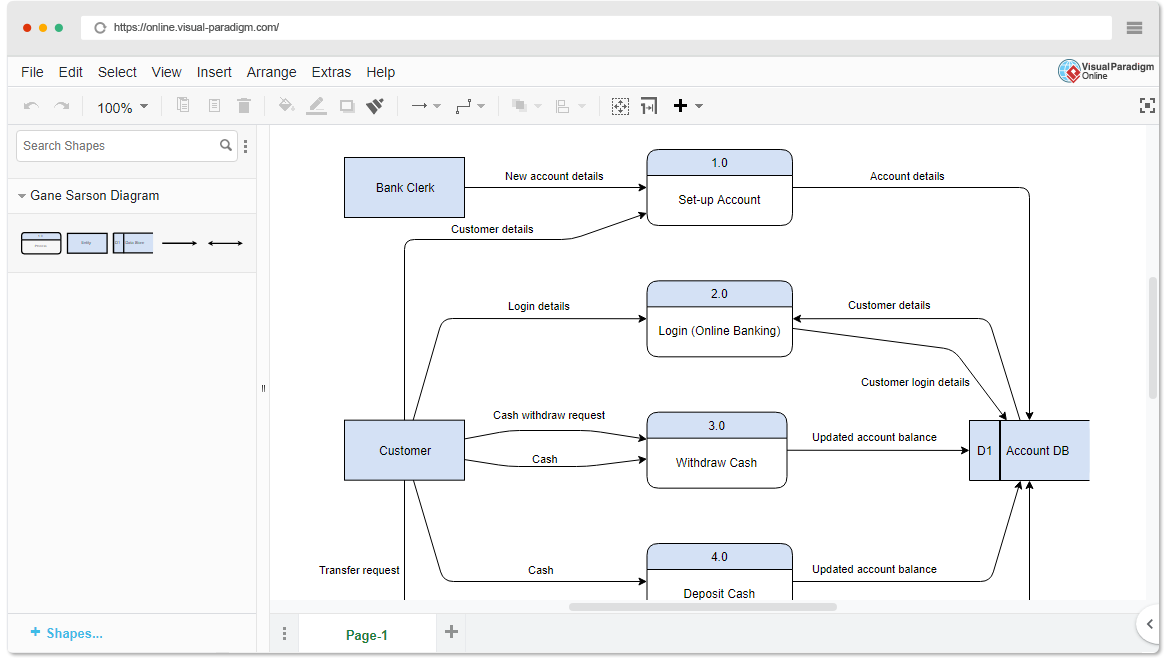
Components of Gane-Sarson Data Flow Diagrams
To create Gane-Sarson DFDs, you need to understand the essential components:
1. Processes:
Processes are represented as rectangles in a DFD. They represent specific tasks or functions within a system. Each process has a unique identifier and a clear name that describes its function.
2. Data Flows:
Data flows are represented as arrows connecting processes, data stores, and external entities. They represent the movement of data from one point to another within the system. Data flows are labeled to indicate the type of data being transferred.
3. Data Stores:
Data stores are represented as parallel lines. They represent where data is stored within the system. Data stores can include databases, files, or any other storage locations.
4. External Entities:
External entities are entities outside of the system being modeled. They can be users, other systems, or any external source or destination of data. External entities are represented as squares or rectangles.
5. Data Stores to Data Flows:
Data stores connect to data flows with a specific notation to indicate the read (retrieve) and write (update) operations on the data store.
Learning by Examples with Visual Paradigm Online
Visual Paradigm Online is a powerful tool for creating Gane-Sarson DFDs with ease. It offers some templates and intuitive features to help you get started quickly. Here’s how you can learn by examples using Visual Paradigm Online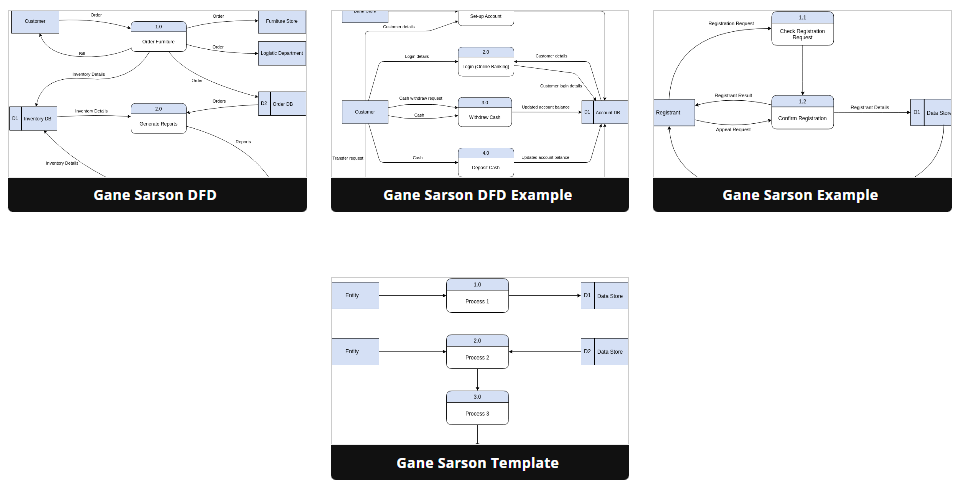
Step 1: Sign Up and Log In
- Visit the Visual Paradigm Online website and sign up for an account if you don’t already have one.
- Log in to your account to access the diagramming tools.
Step 2: Choose a Gane-Sarson DFD Template
- Click on “Create Diagram” or a similar option in the dashboard.
- Select “Data Flow Diagram” or a related category.
- Choose a Gane-Sarson DFD template from the available options. These templates are pre-designed and ready for customization.
Step 3: Customize the Diagram
- Once you’ve selected a template, you can start customizing it by adding processes, data flows, data stores, and external entities.
- Use the editing tools provided by Visual Paradigm Online to label and connect the components appropriately.
Step 4: Explore Examples and Documentation
- Visual Paradigm Online offers documentation and tutorials to help you understand the Gane-Sarson notation and best practices for creating DFDs.
- You can also explore a variety of example diagrams to gain inspiration and insight into how DFDs are used in real-world scenarios.
Step 5: Save and Share
- Save your work within Visual Paradigm Online to access it at any time.
- Share your diagrams with team members or stakeholders for collaboration and feedback.
Conclusion
Gane-Sarson Data Flow Diagrams provide a structured and standardized approach to modeling data flow within information systems. With the help of Visual Paradigm Online and its extensive collection of templates, you can quickly learn and create effective DFDs for your projects. Remember that practice and exploration are key to mastering this valuable technique for system analysis and design.
This post is also available in Deutsche, Español, فارسی, Français, English, Bahasa Indonesia, 日本語, Polski, Portuguese, Ру́сский, Việt Nam, 简体中文 and 繁體中文.
