


Beginner’s Guide to SSADM DFD Diagrams with Visual Paradigm Online
Introduction
System Structured Analysis and Design Methodology (SSADM) is a widely-used approach for modeling and designing information systems. Data Flow Diagrams (DFDs) are an integral part of SSADM, used to visualize the flow of data within a system. In this beginner’s guide, we will introduce you to SSADM DFD Diagrams and show you how to create them using Visual Paradigm Online, leveraging its extensive collection of templates for easy learning through examples.
What is a Data Flow Diagram (DFD)?
A Data Flow Diagram (DFD) is a graphical representation of how data moves within a system. It is a powerful tool for understanding the processes, data sources, data destinations, and data transformations that occur within a system. DFDs help analysts and designers to model and document the flow of information in a clear and organized manner.
Components of a DFD:
- Processes: Represented as circles or ovals, processes in a DFD depict the functions or activities that manipulate data.
- Data Stores: These are represented as rectangles, and they depict where data is stored within the system.
- Data Flows: Arrows represent data flows, showing how data moves from one component to another.
- External Entities: These are represented as squares or rectangles and represent external entities, such as users, customers, or other systems, interacting with the system.
Creating SSADM DFD Diagrams in Visual Paradigm Online
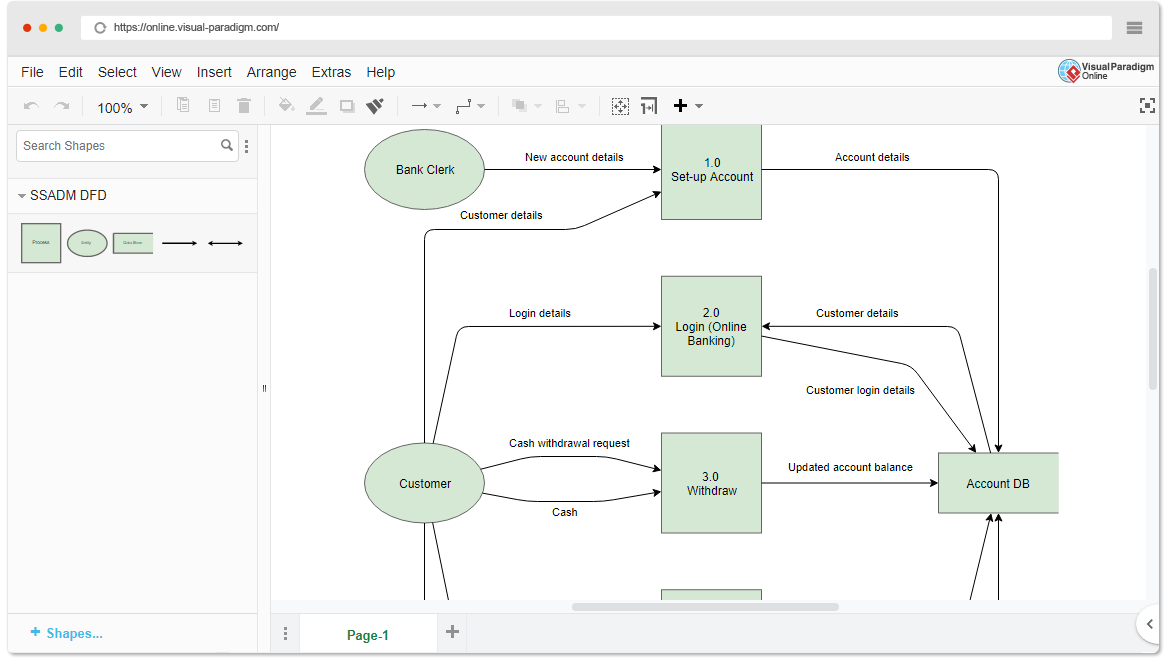
Visual Paradigm Online is a user-friendly online diagramming tool that provides a range of templates to help you create SSADM DFD Diagrams with ease. Here’s how to get started:
Step 1: Sign Up for Visual Paradigm Online
- Go to the Visual Paradigm Online website (https://online.visual-paradigm.com/).
- Sign up for a free account or log in if you already have one.
Step 2: Choose a DFD Template
- After logging in, click on the “Diagram” option in the top menu.
- Select “Data Flow Diagram” from the list of available templates.
Step 3: Add Components
- To add processes, data stores, data flows, and external entities, simply drag and drop them from the left panel onto the canvas.
- Name and label each component to make your diagram understandable.
Step 4: Connect Components
- Use arrows to connect processes, data stores, and external entities to represent the flow of data.
- You can add descriptions or use color coding to add additional information to the diagram.
Step 5: Save and Share
- Save your diagram on Visual Paradigm Online.
- Share it with your team or collaborators for feedback or further development.
Learning by Examples
Visual Paradigm Online offers a large collection of SSADM DFD Diagram templates that you can use as examples to learn how to create your own diagrams. Here’s how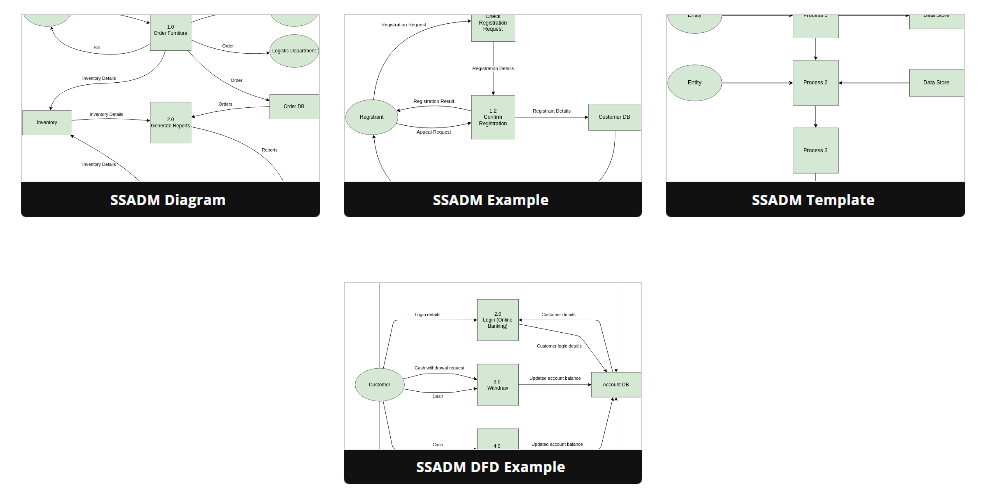
- In Visual Paradigm Online, click on the “Diagram” option in the top menu.
- Choose “Data Flow Diagram” from the list of templates.
- Browse through the available templates to find examples relevant to your project or learning goals.
- Select an example template, and it will open in the editor.
- Study the example to understand how processes, data stores, data flows, and external entities are connected and labeled.
- Modify the example to fit your specific project or create a new diagram from scratch using the knowledge you’ve gained.
Conclusion
Creating SSADM DFD Diagrams using Visual Paradigm Online is a straightforward process, especially when you have access to a wide range of templates that serve as learning examples. By following the steps outlined in this beginner’s guide and leveraging the templates available, you can effectively model and document the data flow within your systems, aiding in the analysis and design process. Happy diagramming!
This post is also available in Deutsche, Español, فارسی, Français, English, Bahasa Indonesia, 日本語, Polski, Portuguese, Ру́сский, Việt Nam, 简体中文 and 繁體中文.
