


Beginner’s Guide to Yourdon and Coad Diagrams with Visual Paradigm Online
Introduction
Yourdon and Coad diagrams are a type of visual modeling tool used in software engineering and system design. They help in representing the structure and behavior of a system or software application. In this beginner’s guide, we’ll introduce you to Yourdon and Coad diagrams and show you how to create them using Visual Paradigm Online, a popular online diagramming tool.
What Are Yourdon and Coad Diagrams?
Yourdon and Coad diagrams are part of the Structured Systems Analysis and Design Method (SSADM). They are used for modeling and documenting a system’s structure, processes, and data flows. These diagrams are particularly useful during the early stages of software development to understand and communicate system requirements.
There are several types of Yourdon and Coad diagrams, but we’ll focus on the three most commonly used ones:
- Data Flow Diagram (DFD): DFDs represent how data flows within a system. They show the processes that manipulate data and the data stores where information is stored.
- Entity-Relationship Diagram (ERD): ERDs depict the data model of a system, including entities (objects), their attributes, and the relationships between them.
- State Transition Diagram (STD): STDs are used to model the behavior of a system or an entity by showing the possible states it can be in and the transitions between those states.
Getting Started with Visual Paradigm Online
Before we create Yourdon and Coad diagrams, let’s get started with Visual Paradigm Online:
- Visit the Visual Paradigm Online website: Go to Visual Paradigm Online and sign up for a free account if you don’t have one already.
- Log in: Once you’re logged in, you can start creating diagrams.
Creating Yourdon and Coad Diagrams
Data Flow Diagram (DFD)
- Create a new project: Click on “New Project” and choose “Diagram” under the “Project” section.
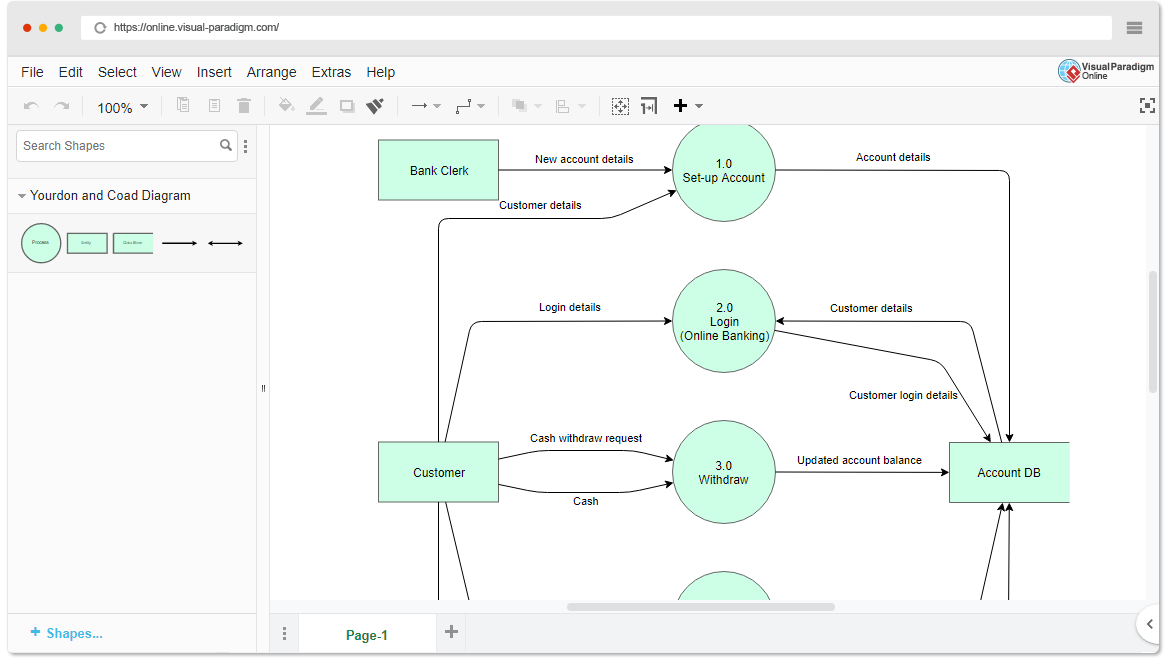
- Select DFD template: In the diagram editor, click on “New Diagram” and choose the “Data Flow Diagram” template.
- Add elements: Drag and drop process boxes, data stores, data flow arrows, and external entities onto your canvas. Connect them to represent how data flows through the system.
- Label elements: Double-click on elements to add labels and describe their functions.
- Save your work: Don’t forget to save your diagram regularly.
Entity-Relationship Diagram (ERD)
- Create a new project: Click on “New Project” and choose “Diagram” under the “Project” section.
- Select ERD template: In the diagram editor, click on “New Diagram” and choose the “Entity-Relationship Diagram” template.
- Add entities and relationships: Use shapes to represent entities and lines to connect them with relationships. Define attributes for each entity.
- Label elements: Double-click on entities, relationships, and attributes to add names and descriptions.
- Save your work: Save your diagram to keep your progress safe.
State Transition Diagram (STD)
- Create a new project: Click on “New Project” and choose “Diagram” under the “Project” section.
- Select STD template: In the diagram editor, click on “New Diagram” and choose the “State Transition Diagram” template.
- Add states and transitions: Create states for your system or entity and connect them with transitions to represent how the system changes from one state to another.
- Label elements: Double-click on states and transitions to add names and descriptions.
- Save your work: Always save your diagram to avoid losing your work.
Learning by Examples
Visual Paradigm Online provides a variety of templates and examples to help you learn and get started with Yourdon and Coad diagrams. Explore their template library and study existing diagrams to understand best practices and how to use these diagrams effectively in your projects.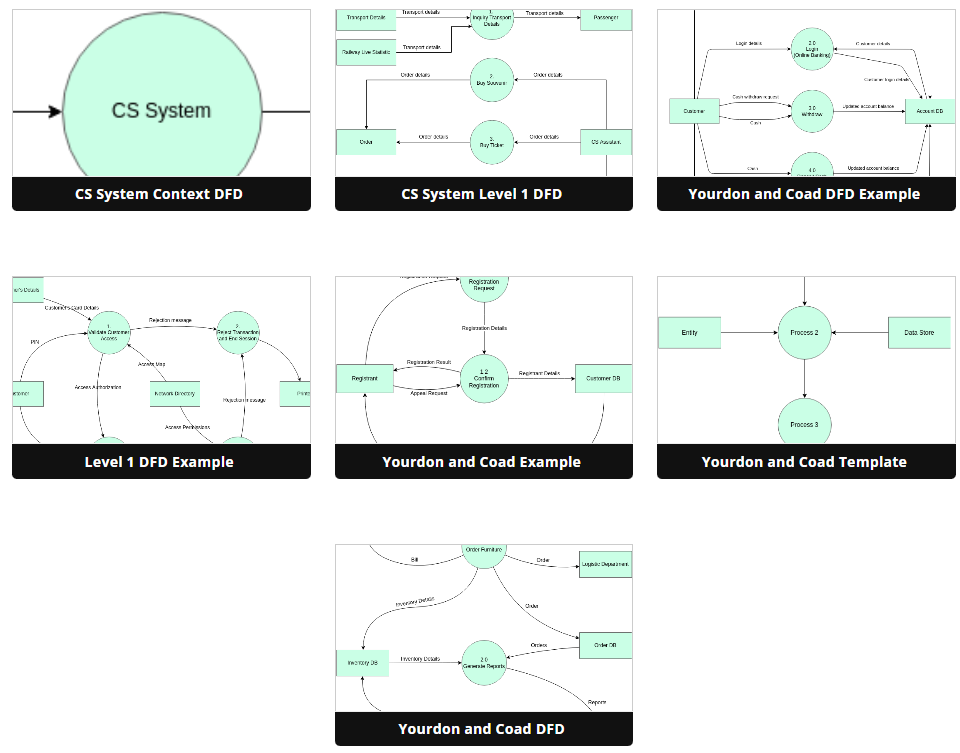
Remember that practice is key to mastering Yourdon and Coad diagrams, so don’t hesitate to experiment and create your own diagrams to solidify your understanding.
That’s it! You’ve now been introduced to Yourdon and Coad diagrams and know how to create them using Visual Paradigm Online. Happy diagramming!
This post is also available in Deutsche, Español, فارسی, Français, English, Bahasa Indonesia, 日本語, Polski, Portuguese, Ру́сский, Việt Nam, 简体中文 and 繁體中文.
