


Tracking PowerPoint Slideshow Performance with Google Analytics
Visual Paradigm Online is continually enhancing its features to help you create captivating presentations. One such feature is the integration with Google Analytics, allowing you to monitor the performance of your PowerPoint slideshows. In this article, we will guide you through the process of setting up Google Analytics for your presentations, empowering you with valuable insights into your audience’s engagement.

Setting Up Google Analytics for Your Slideshow
1.Create a New Property
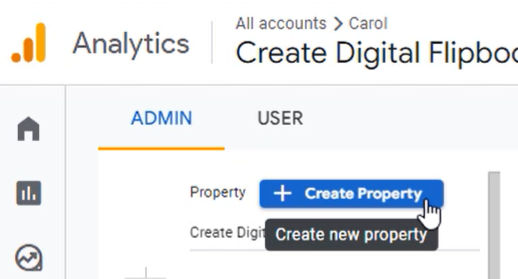
Start by logging into your Google Analytics account. Create a new property dedicated to your slideshow. This step involves providing a name for the property, entering relevant business details, specifying your objectives, and selecting the appropriate data collection platform.
2. Copy the Slideshow URL

Head over to your Visual Paradigm Online workspace where your slideshow is located. Copy the URL of your presentation.
3. Create a Data Stream
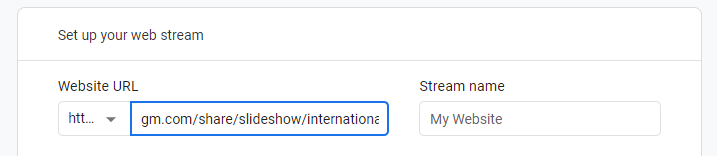
Return to your Google Analytics account and navigate to the webstream section. Paste the slideshow URL in the designated field. Specify a name for the stream and click the “Create Stream” button. This action creates the data stream for your slideshow.
4. Obtain the Measurement ID
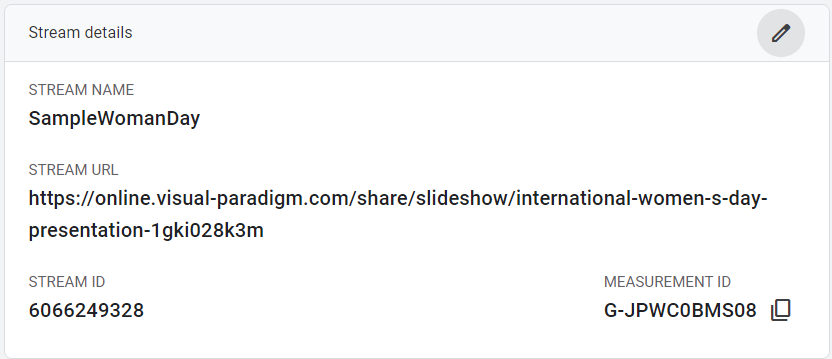
Once you’ve created the data stream, you’ll be provided with a Measurement ID. Be sure to copy this ID.
5. Configure Visual Paradigm Online
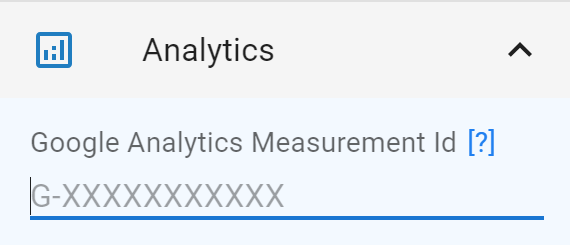
Return to your Visual Paradigm Online workspace and open the settings for your slideshow. Expand the “Analytics” section and paste the Measurement ID obtained from Google Analytics. Don’t forget to save the changes by clicking the “Finish” button.
Tracking Slideshow Performance
With the setup complete, Google Analytics will commence measuring your PowerPoint slideshow’s performance. This includes tracking various metrics and providing live reports on audience distribution. Here’s what you can gain:
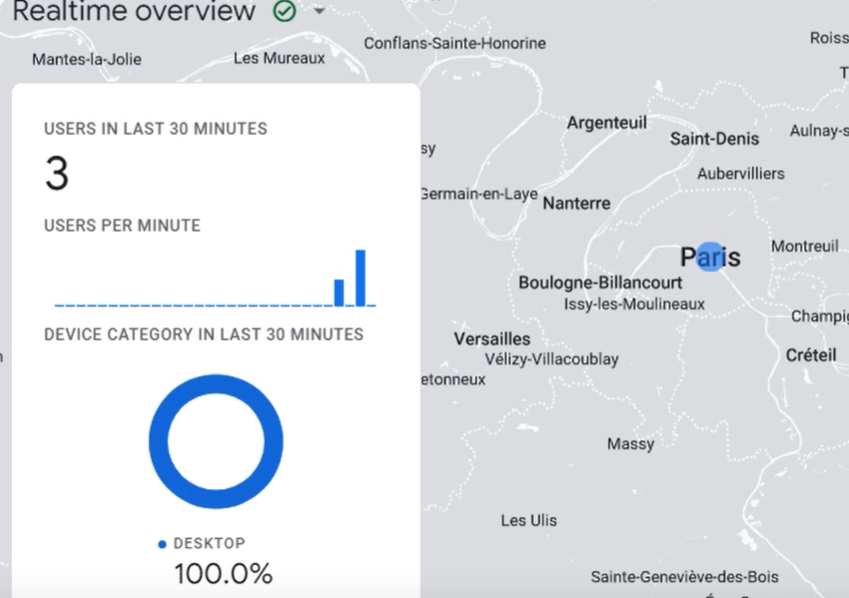
- Audience Engagement: Discover how your audience engages with your presentation.
- Data-Driven Insights: Make informed improvements based on the collected data.
In conclusion, Visual Paradigm Online’s integration with Google Analytics simplifies the tracking and analysis of your PowerPoint slideshows’ performance. By following these steps, you can harness the power of data to enhance your presentations and create a more engaging experience for your audience.
Stay tuned for more exciting updates and features from Visual Paradigm Online!
This post is also available in Deutsche, Español, فارسی, Français, English, Bahasa Indonesia, 日本語, Polski, Portuguese, Ру́сский, Việt Nam, 简体中文 and 繁體中文.
