


Comprehensive Guide to Affinity Diagrams
Introduction
An affinity diagram is a powerful tool used for organizing and structuring a large number of ideas or information into natural relationships. It is particularly useful for generating insights, facilitating teamwork, and finding patterns within a chaotic set of data. This guide will explore the purpose, key concepts, and elements of affinity diagrams, and provide examples using pre-made templates available in Visual Paradigm Online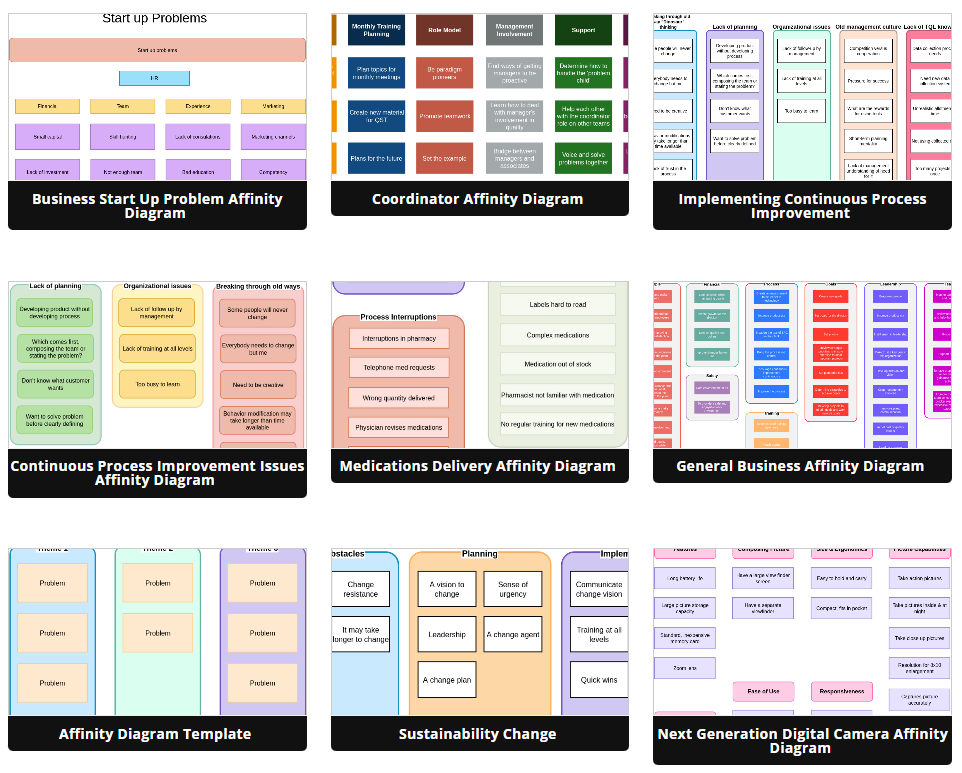
Purpose of Affinity Diagrams
The primary purpose of an affinity diagram is to:
- Organize Ideas: It helps in organizing and categorizing a multitude of ideas or data points into related groups.
- Generate Insights: It encourages creative thinking and intuition among team members, leading to the discovery of valuable insights.
- Facilitate Consensus: It serves as a collaborative tool for teams to reach a consensus on how to structure and prioritize ideas.
- Solve Complex Problems: It is effective when dealing with complex issues, large sets of data, or seemingly chaotic information.
- Analyze Verbal Data: It is valuable for analyzing qualitative data, such as survey responses or interview transcripts.
- Theme Development: It aids in developing relationships and themes among ideas or data points.
- Attribute Reduction: It assists in reducing attributes to categories that can be addressed at a higher level.
Key Concepts and Elements
1. Brainstorming Session:
- The process begins with a brainstorming session where participants generate a wide range of ideas or pieces of information related to the topic of interest.
2. Idea Cards:
- Each idea or data point is written on a separate sticky note or card. These idea cards are typically concise and focused.
3. Affinity Groups:
- During the brainstorming session or afterward, participants group the idea cards based on their natural relationships or similarities.
4. Affinity Diagram Board:
- The affinity diagram board is where the idea cards are physically or digitally placed. This can be a whiteboard, poster, or software tool.
5. Labeling:
- Each group of idea cards is given a label or heading that represents the common theme or relationship among those ideas.
6. Hierarchy:
- Ideas can be further organized hierarchically, with main themes or categories branching into subcategories if necessary.
7. Consensus:
- The process often involves discussions and iterations until the team reaches a consensus on the final structure of the affinity diagram.
8. Visualization:
- The final result is a visual representation of the organized ideas, with cards grouped by affinity and connected with lines or arrows to show relationships.
Learn by Examples Using Visual Paradigm Online
Visual Paradigm Online offers pre-made templates for creating affinity diagrams. Here’s a step-by-step example of how to use these templates:
Step 1: Access Visual Paradigm Online and create a new project.
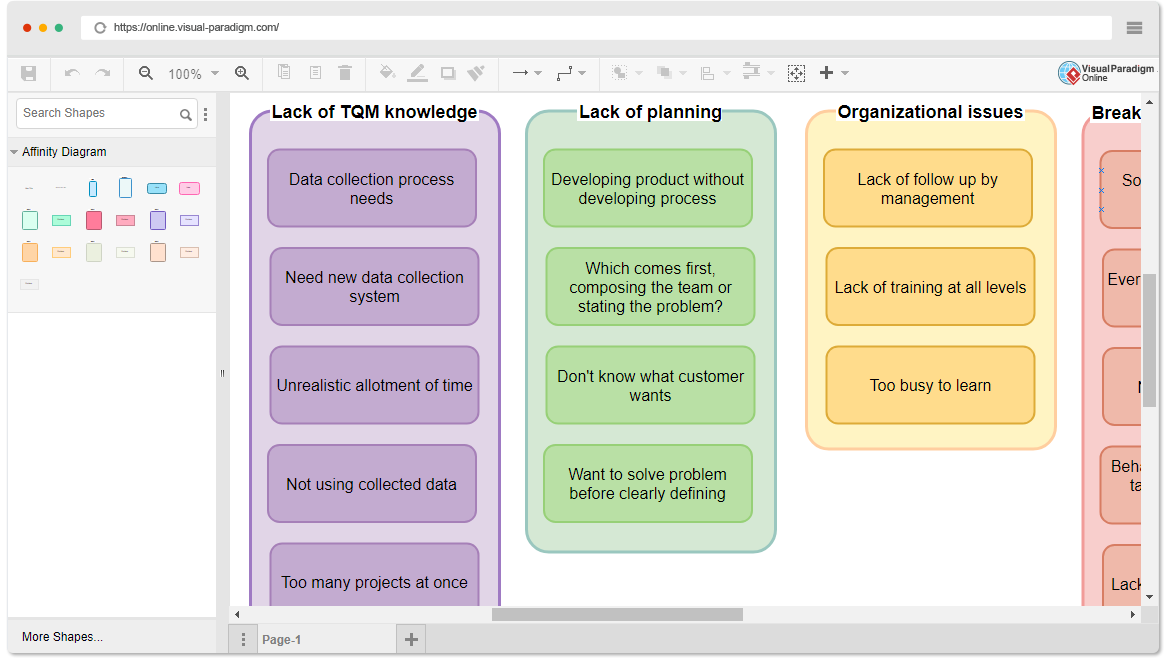
Step 2: Select the “Affinity Diagram” template from the template library.
Step 3: Customize the template by renaming categories and adding idea cards to represent your data or ideas.
Step 4: Drag and drop idea cards into appropriate categories based on their affinity.
Step 5: Connect related cards using lines or arrows to visually represent relationships.
Step 6: Label each category to describe its common theme.
Step 7: Collaborate with your team to refine the diagram and reach a consensus on the organization of ideas.
Step 8: Save and share the final affinity diagram with your team or stakeholders.
By following these steps and using Visual Paradigm Online’s templates, you can efficiently create and utilize affinity diagrams to tackle complex problems, organize data, and gain valuable insights through teamwork and structured thinking.
This post is also available in Deutsche, Español, فارسی, Français, English, Bahasa Indonesia, 日本語, Polski, Portuguese, Ру́сский, Việt Nam, 简体中文 and 繁體中文.
