


Comprehensive Guide to Causal Loop Diagrams
Introduction
A Causal Loop Diagram (CLD) is a powerful tool for understanding and representing the causal relationships within complex systems. It helps visualize how variables in a system influence each other and whether these influences are positive (reinforcing) or negative (balancing). This comprehensive guide will cover the purpose, key concepts, and elements of CLDs and provide examples using pre-made templates available in Visual Paradigm Online.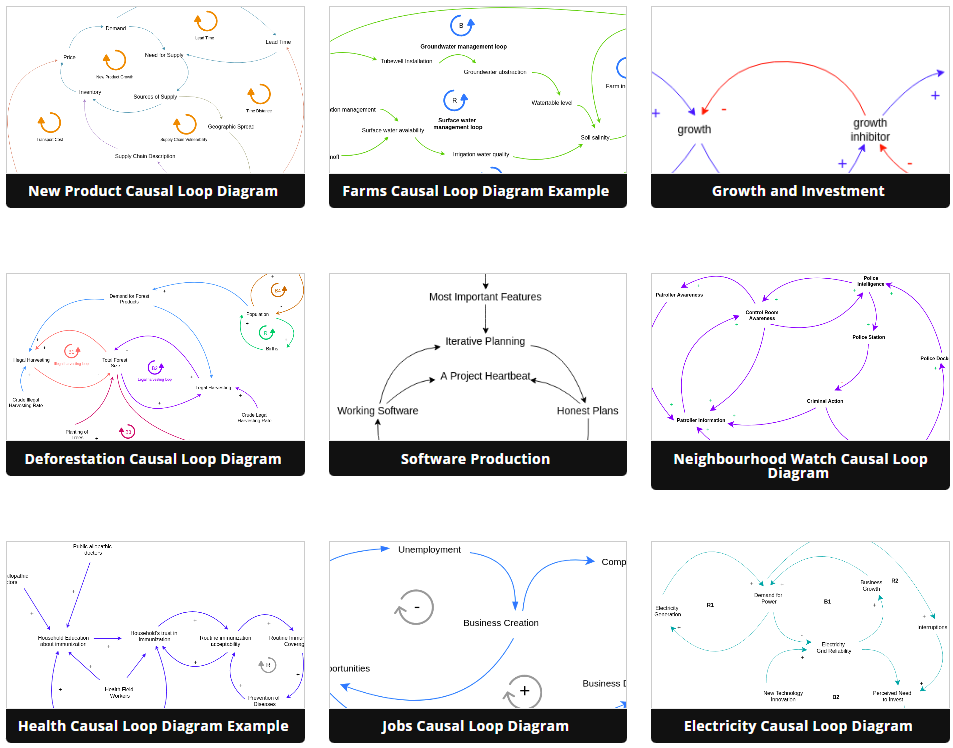
Purpose of Causal Loop Diagrams
Causal Loop Diagrams serve several important purposes:
- Understanding Complex Systems: They help in gaining a deeper understanding of complex systems by identifying the cause-and-effect relationships between variables.
- Policy Analysis: CLDs can be used to analyze the potential impacts of policy changes or interventions within a system.
- Decision Making: They aid in informed decision-making by providing insights into the consequences of different actions.
- Communication: CLDs facilitate communication among stakeholders by visually representing the interdependencies in a system.
- Problem Solving: They assist in identifying root causes of problems and exploring potential solutions.
Key Concepts and Elements of Causal Loop Diagrams
1. Variables
Variables are the key elements in a CLD. They represent quantities or attributes within the system that can change over time. Variables are usually depicted as ovals or rectangles with labels.
2. Arrows
Arrows represent causal relationships between variables. There are two types of causal links:
- Positive (+): A positive link indicates that when the causal variable increases, all else being equal, the effect variable also increases. Conversely, a decrease in the causal variable leads to a decrease in the effect variable.
- Negative (-): A negative link signifies that an increase in the causal variable leads to a decrease in the effect variable, and vice versa. It represents an inverse relationship.
3. Loop Labels
Loop labels are words or phrases used to describe feedback loops within the CLD. Feedback loops can be either:
- Reinforcing (R): A reinforcing loop is a cycle in which an initial change in a variable propagates through the loop and reinforces the deviation in the same direction. It often leads to exponential growth or decline.
- Balancing (B): A balancing loop is a cycle in which an initial change in a variable propagates through the loop and opposes the initial deviation, striving to reach a goal or maintain stability.
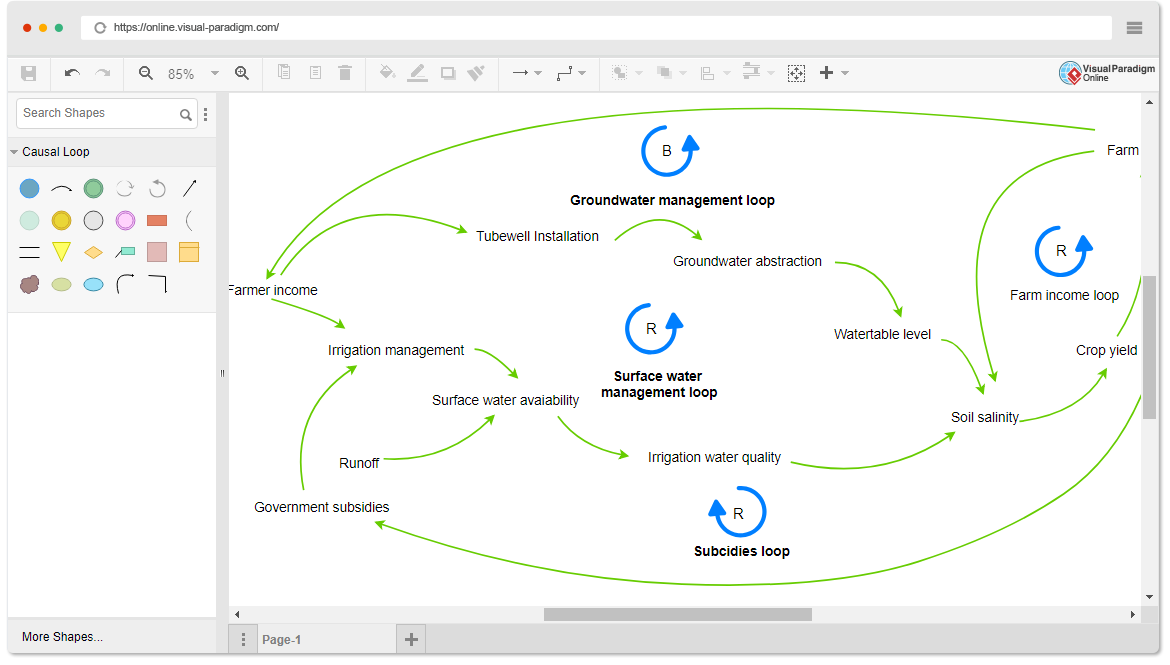
Learn by Examples Using Visual Paradigm Online
Visual Paradigm Online offers a user-friendly platform for creating CLDs with pre-made templates. Let’s explore an example using a positive reinforcing loop.
Example: Positive Reinforcing Loop
Scenario: We want to illustrate how an increase in bank balance leads to increased earned interest, creating a positive reinforcing loop.
- Access Visual Paradigm Online: Go to Visual Paradigm Online (https://online.visual-paradigm.com/).
- Create a New Diagram: Choose “Causal Loop Diagram” as the diagram type and create a new diagram.
- Add Variables: Add two variables – “Bank Balance” and “Earned Interest” – to your diagram. Label them accordingly.
- Add Arrows: Create two arrows:
- One from “Bank Balance” to “Earned Interest” with a “+” symbol to represent the positive causal link.
- Another from “Earned Interest” to “Bank Balance” with a “+” symbol to indicate that earned interest contributes to the bank balance.
- Add a Loop Label: Insert a loop label and designate it as “R” to signify the positive reinforcing loop.
- Visualize the Loop: Connect the arrows to form a loop, and use connectors to create a clear and organized diagram.
- Narrative: Write a brief narrative explaining the relationship between bank balance and earned interest, emphasizing the positive reinforcing nature of the loop.
- Save and Share: Save your CLD and share it with others for analysis and discussion.
This example illustrates how Visual Paradigm Online can be used to create CLDs for various scenarios, helping you understand complex systems and their feedback dynamics.
Conclusion
Causal Loop Diagrams are valuable tools for modeling and analyzing the causal relationships within complex systems. By understanding the purpose, key concepts, and elements of CLDs, and practicing with examples using tools like Visual Paradigm Online, you can enhance your ability to visualize and address complex problems in diverse fields, from business to environmental science.
This post is also available in Deutsche, Español, فارسی, Français, English, Bahasa Indonesia, 日本語, Polski, Portuguese, Ру́сский, Việt Nam, 简体中文 and 繁體中文.
