


Comprehensive Guide to Dendrogram Diagrams
Introduction
A dendrogram is a graphical representation of hierarchical relationships between objects, which are often used in various fields such as data analysis, computational biology, and phylogenetics. This guide will cover the purpose, key concepts, elements, and provide examples of dendrogram diagrams using pre-made templates available in Visual Paradigm Online.
Purpose of Dendrogram Diagrams
Dendrogram diagrams serve several purposes in different domains:
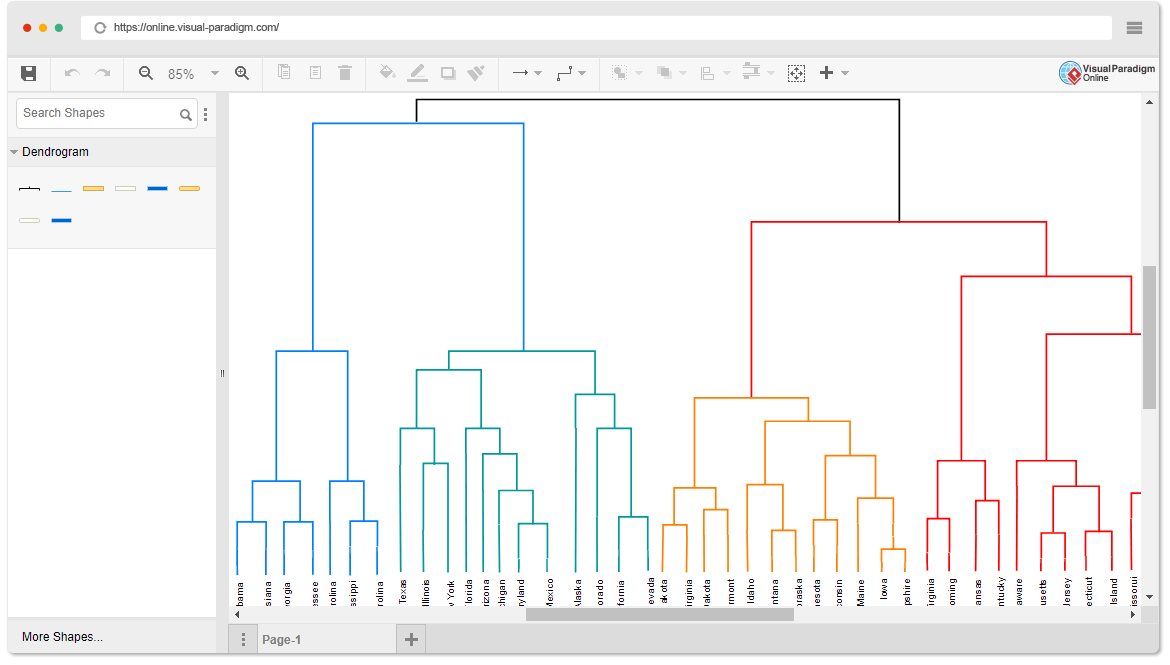
- Hierarchical Clustering: Dendrograms are frequently used in hierarchical clustering to visualize the arrangement of clusters resulting from clustering analyses. They provide insights into how data points are grouped together at different levels of similarity or distance.
- Computational Biology: In computational biology, dendrograms are used to represent the clustering of genes or samples. They are often displayed alongside heatmaps, helping researchers identify patterns and relationships among genetic data.
- Phylogenetics: Dendrograms play a crucial role in phylogenetics, where they illustrate the evolutionary relationships among biological taxa. In this context, they are commonly referred to as phylogenetic trees.

Key Concepts
To create and understand dendrogram diagrams effectively, it’s essential to grasp some key concepts:
- Hierarchical Structure: Dendrograms display data in a hierarchical structure, with each level representing different levels of grouping or similarity.
- Nodes: Nodes in a dendrogram represent data points or clusters. Terminal nodes represent individual data points, while internal nodes represent clusters or groupings of data points.
- Branches: Branches or edges connect nodes in the dendrogram. The length or height of these branches typically represents the dissimilarity or distance between the nodes they connect.
- Height: The height of a node or the length of a branch is proportional to the dissimilarity or distance between the clusters it connects. The greater the height, the more dissimilar the clusters.
Elements of a Dendrogram Diagram
A dendrogram diagram consists of the following key elements:
- Root Node: The topmost node in the dendrogram represents the entire dataset.
- Internal Nodes: These nodes represent clusters of data points and are connected by branches.
- Terminal Nodes: Also known as leaves, these nodes represent individual data points or the most granular level of grouping.
- Branches: Branches connect nodes and indicate the dissimilarity or distance between them.
Conclusion
Dendrogram diagrams are powerful tools for visualizing hierarchical relationships in various fields, including data analysis, biology, and phylogenetics. Understanding the key concepts and elements of dendrograms is crucial for creating informative and insightful diagrams. Visual Paradigm Online provides a user-friendly platform for creating dendrogram diagrams and other types of visual representations. Experiment with different templates and data to gain a deeper understanding of dendrograms and their applications.
This post is also available in Deutsche, Español, فارسی, Français, English, Bahasa Indonesia, 日本語, Polski, Portuguese, Ру́сский, Việt Nam, 简体中文 and 繁體中文.
