


Comprehensive Guide to EPC Diagrams
Introduction
Event-driven Process Chain (EPC) diagrams are a powerful tool for modeling, analyzing, and improving business processes. In this comprehensive guide, we will explore the purpose, key concepts, and elements of EPC diagrams. We’ll also provide examples using pre-made templates available in Visual Paradigm Online.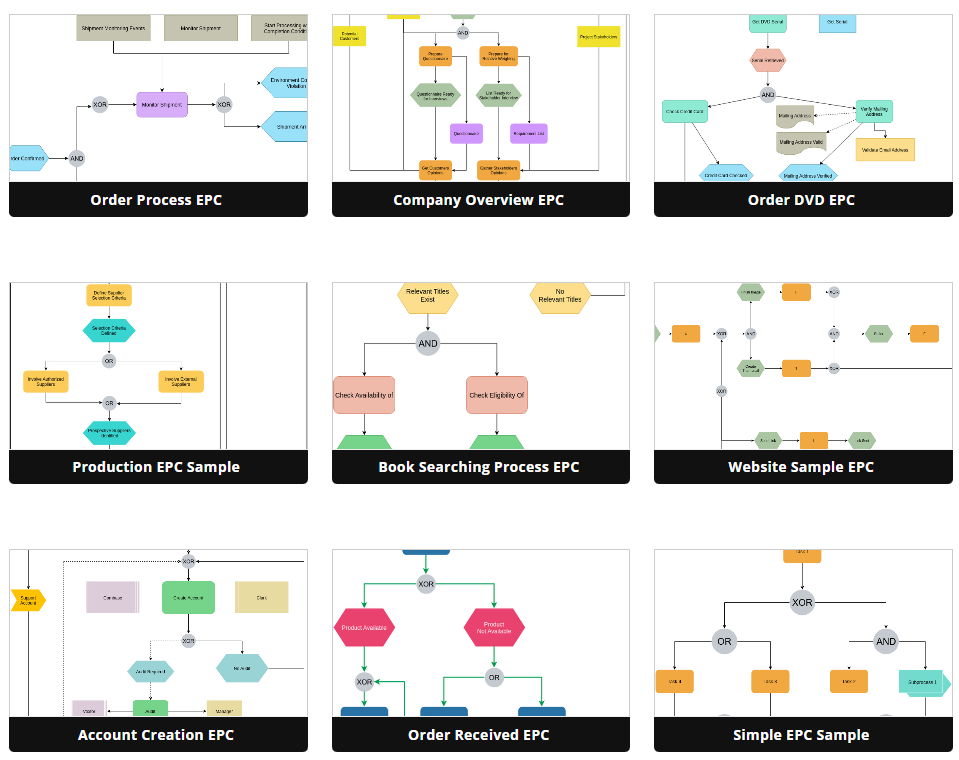
1. Introduction to EPC Diagrams
Event-driven Process Chain (EPC) diagrams are a type of flowchart used for business process modeling. They were developed within the Architecture of Integrated Information Systems (ARIS) framework in the early 1990s by August-Wilhelm Scheer. EPC diagrams help organizations visualize and document their business processes, making them a valuable tool for enterprise resource planning and business process improvement.
2. Purpose of EPC Diagrams
EPC diagrams serve several essential purposes in business process management:
- Modeling: They provide a graphical representation of business processes, making them easier to understand and communicate.
- Analysis: EPC diagrams help identify bottlenecks, inefficiencies, and areas for process optimization.
- Redesign: Organizations can use EPC diagrams to plan and implement improvements in their business processes.
- Control: EPC diagrams can be used to control and manage autonomous workflow instances, particularly in work-sharing scenarios.
3. Key Concepts in EPC Diagrams
Before delving into the elements of EPC diagrams, it’s essential to understand some key concepts:
- Events: Events represent specific circumstances or states that trigger functions or processes. Events are depicted as hexagons and mark the starting and ending points of an EPC diagram.
- Functions: Functions are active elements that represent tasks or activities within a business process. They are shown as rounded rectangles and describe transformations from an initial state to a resulting state.
- Process Owner: A process owner is responsible for a function and is usually part of an organizational unit. Process owners are depicted as squares with a vertical line.
- Organization Unit: Organization units determine which part of the organization is responsible for specific functions. They are represented as ellipses with a vertical line.
- Information, Material, or Resource Object: These objects represent real-world entities used as input or output for functions. They are shown as rectangles.
- Logical Connector: Logical connectors, such as OR, AND, and XOR, define logical relationships between elements in the control flow of the diagram.
- Control Flow: Control flows are dashed arrows that connect events, functions, and logical connectors, creating a chronological sequence of activities.
- Information Flow: Information flows illustrate connections between functions and input or output data.
- Organization Unit Assignment: These connections show the relationship between an organization unit and the function it is responsible for.
- Process Path: Process paths serve as navigation aids and indicate connections between different processes. They are represented as a compound symbol consisting of a function symbol superimposed upon an event symbol.
4. Elements of an EPC Diagram
Let’s delve deeper into the key elements used in EPC diagrams:
- Event: Hexagon shape, represents passive triggering conditions.
- Function: Rounded rectangle, represents active tasks or activities.
- Process Owner: Square with a vertical line, indicates responsibility for a function.
- Organization Unit: Ellipse with a vertical line, shows which part of the organization is responsible for a function.
- Information, Material, or Resource Object: Rectangle, portrays real-world objects.
- Logical Connector: Used to define logical relationships (OR, AND, XOR).
- Control Flow: Dashed arrow, connects events, functions, and logical connectors.
- Information Flow: Represents connections between functions and data.
- Organization Unit Assignment: Shows the connection between an organization unit and a function.
- Process Path: Navigation aid combining function and event symbols.
5. Learn by Examples
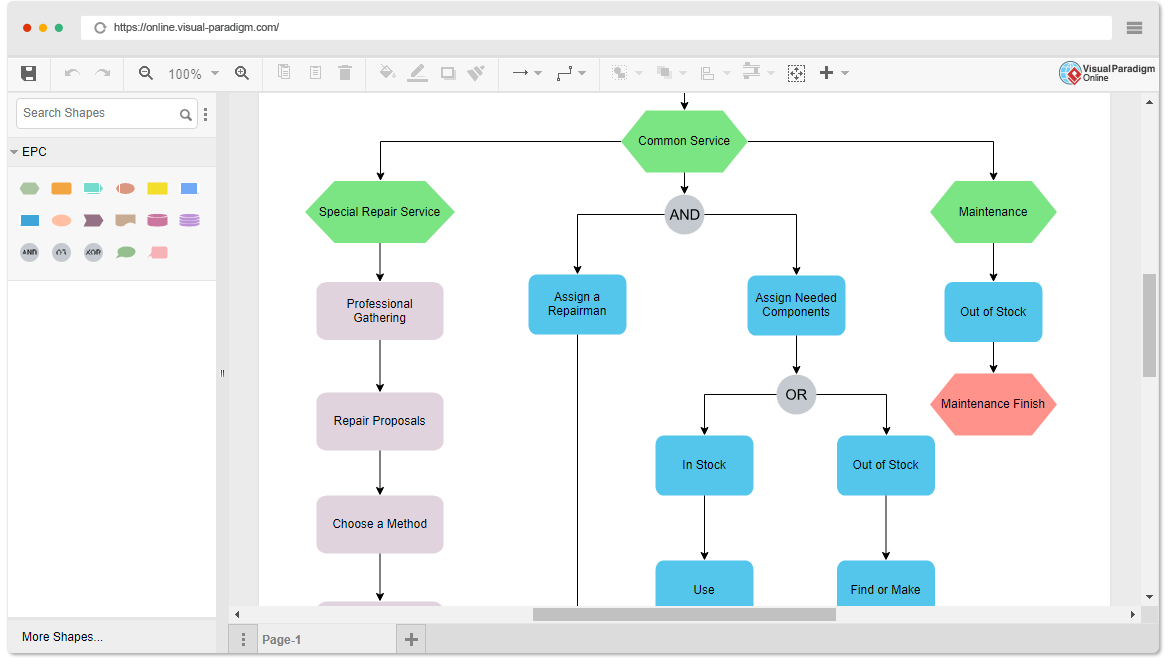
Now, let’s illustrate EPC diagrams with two examples using pre-made templates available in Visual Paradigm Online.
Example 1: Sales Order Processing
Imagine a company’s sales order processing system. We can create an EPC diagram to visualize this process, starting with the event “New Sales Order Received” and ending with “Order Shipped.”
[Insert EPC Diagram for Sales Order Processing]
Example 2: Procurement Process
Consider a procurement process within an organization. An EPC diagram can represent the steps from “Purchase Requisition” to “Goods Received.”
[Insert EPC Diagram for Procurement Process]
6. Conclusion
Event-driven Process Chain (EPC) diagrams are a valuable tool for modeling, analyzing, and optimizing business processes. Understanding the key elements and concepts in EPC diagrams allows organizations to document and improve their workflows effectively. By using tools like Visual Paradigm Online, businesses can create EPC diagrams to enhance their operational efficiency and streamline processes.
This post is also available in Deutsche, Español, فارسی, Français, English, Bahasa Indonesia, 日本語, Polski, Portuguese, Ру́сский, Việt Nam, 简体中文 and 繁體中文.
