


Comprehensive Guide to Information Flow Diagrams
Introduction to Information Flow Diagrams
An Information Flow Diagram (IFD) is a graphical representation that illustrates how information flows within and between organizations, departments, and subsystems. It serves as a valuable tool for understanding and visualizing the movement of data, helping organizations improve communication, identify bottlenecks, and streamline their processes. In this comprehensive guide, we will delve into the purpose, key concepts, and elements of IFDs, followed by examples using pre-made templates available in Visual Paradigm Online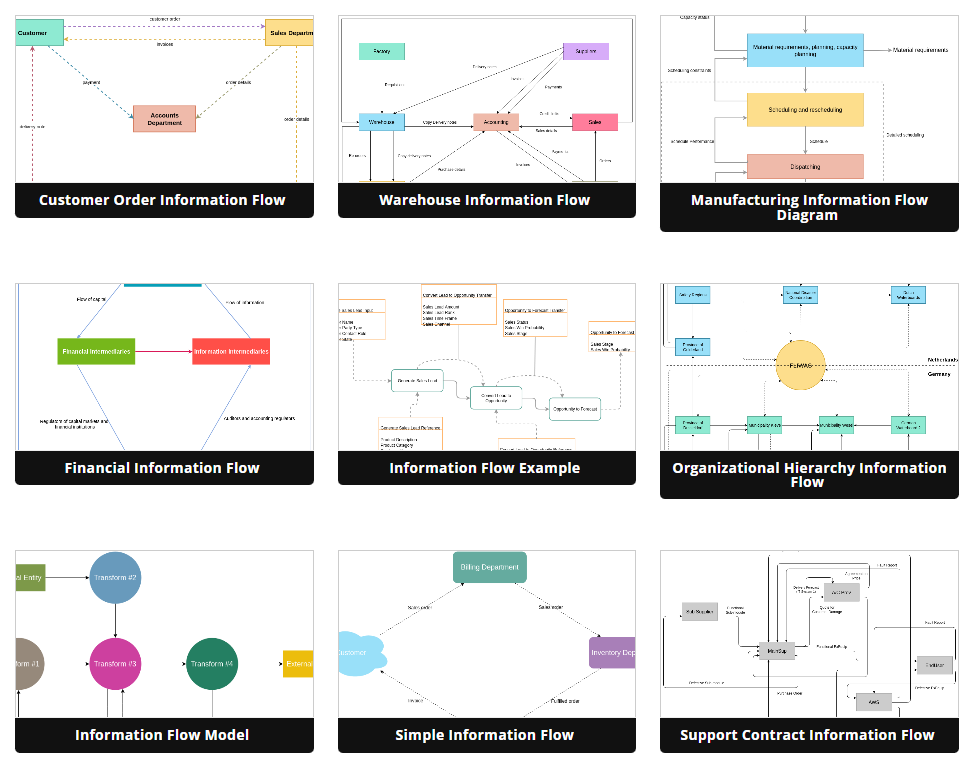
Purpose of Information Flow Diagrams
Information Flow Diagrams serve several crucial purposes:
- High-Level Overview: IFDs provide a high-level overview of how information is exchanged within an organization or between organizations.
- Detailed Task Analysis: They can highlight detailed flows within specific tasks, helping teams understand the information exchange within a particular process.
- Organizational Understanding: IFDs describe the flow of information within and around organizations, facilitating a deeper understanding of communication pathways between departments.
- Bottleneck Identification: They help identify bottlenecks in information flow, whether it’s sequential, deferred, real-time, parallel, wheel, one-to-many, many-to-many, or many-to-one-to-many.
Key Concepts and Elements of Information Flow Diagrams
To create an effective Information Flow Diagram, you need to understand its key concepts and elements:
1. Sources and Targets of Information Flow
Information flow diagrams involve various entities that act as sources and targets of information. These entities can include Actors, Use Cases, Nodes, Artifacts, Classes, Components, Ports, Properties, Interfaces, Packages, Activity Nodes, Activity Partitions, or Instance Specifications.
2. Information Flow Arrows
Information flow is represented by dashed lines with an open arrowhead pointing away from the source toward the target. These arrows indicate the direction of data transfer.
3. “Flow” Keyword
Above or below the dashed lines representing information flow, the keyword “Flow” may be written to further clarify the purpose of the arrows.
4. Information Items
Information Items are used as information flow connectors, representing the transfer of data from the source to the target. They abstract the data being exchanged but do not provide specific details about the information itself. They are featureless and serve as connectors between sources and targets.
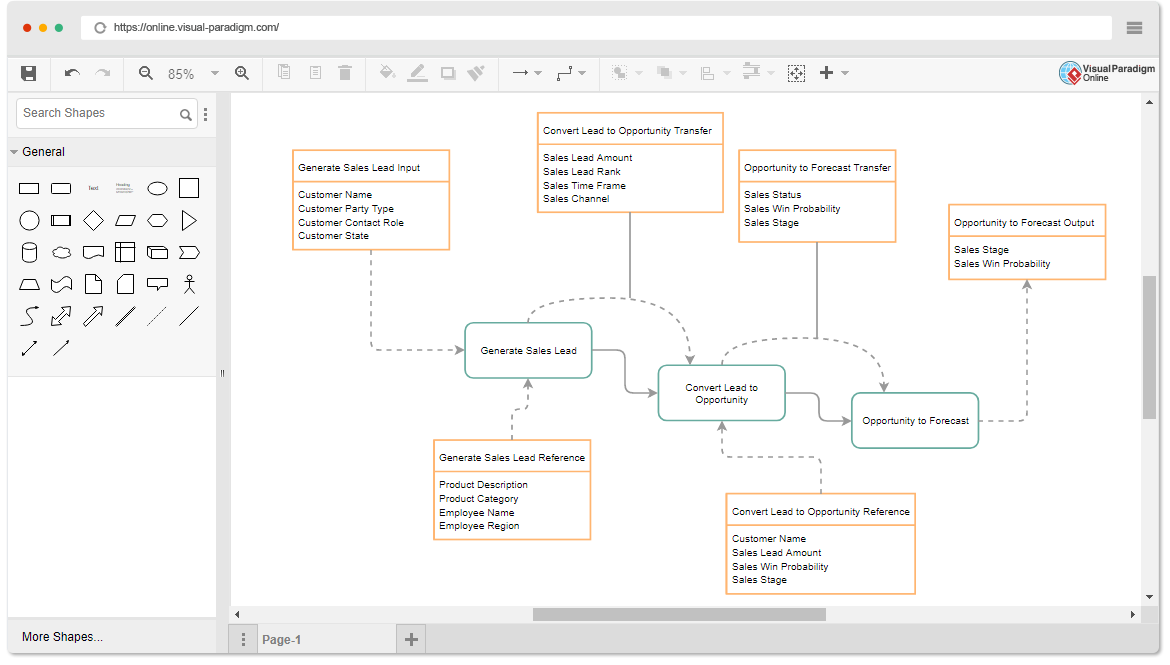
Example Using Pre-Made Templates in Visual Paradigm Online
Visual Paradigm Online offers a user-friendly platform for creating Information Flow Diagrams. Let’s walk through an example using a pre-made template:
- Access Visual Paradigm Online: Log in to your Visual Paradigm Online account or create one if you don’t have an account.
- Choose a Template: Navigate to the “Diagram” section and select “Information Flow Diagram” from the available templates.
- Edit the Diagram: Customize the pre-made template to match your specific scenario. Add sources, targets, and information flow arrows by dragging and dropping elements onto the canvas.
- Label Information Flow: Use text labels to specify the type of information being transferred along each flow arrow. You can also add the “Flow” keyword above or below the arrows.
- Save and Share: Save your diagram within Visual Paradigm Online, and if needed, share it with your team for collaborative editing and feedback.
Information Flow Diagram vs. Data Flow Diagram vs. Flowchart
It’s important to distinguish between Information Flow Diagrams (IFDs), Data Flow Diagrams (DFDs), and Flowcharts, as they serve different purposes:
- Information Flow Diagrams (IFDs): IFDs focus on illustrating the flow of information between sources, destinations, and flows within and between organizations. They emphasize data exchange and communication pathways.
- Data Flow Diagrams (DFDs): DFDs concentrate on processes where inputs are transformed into outputs. They also include databases to show where data is stored within the system. DFDs refer to information destinations as “sinks.”
- Flowcharts: Flowcharts are used to depict the flow of control within a process. They detail the sequence of operations, their order, and conditions under which they occur.
Summary
Information Flow Diagrams are ideal for visualizing the movement of information, whereas Data Flow Diagrams focus on data transformation, and Flowcharts emphasize control flow.
By mastering Information Flow Diagrams and using tools like Visual Paradigm Online, you can enhance your organization’s understanding of information exchange, streamline processes, and improve communication efficiency.
This post is also available in Deutsche, Español, فارسی, Français, English, Bahasa Indonesia, 日本語, Polski, Portuguese, Ру́сский, Việt Nam, 简体中文 and 繁體中文.
