


Comprehensive Guide to Stock and Flow Diagrams
Introduction
Stock and Flow Diagrams are essential tools used in economics, business, accounting, and related fields to represent and understand the dynamics of quantities over time. They help distinguish between stocks and flows, two fundamental concepts in these fields. In this guide, we’ll explore the purpose, key concepts, and elements of Stock and Flow Diagrams, and learn through examples using pre-made templates available in Visual Paradigm Online.
Purpose of Stock and Flow Diagrams
Stock and Flow Diagrams are employed to visualize and model dynamic systems where quantities can be categorized into two main types: stocks and flows. The primary purposes of these diagrams include:
- Understanding Dynamic Systems: They help in comprehending how different quantities change and interact over time within a system.
- Identifying Key Variables: They highlight the key variables that contribute to the accumulation or depletion of stocks.
- Policy Analysis: They are often used in economics and policy analysis to evaluate the effects of various policies or interventions on a system’s behavior.
- Forecasting: They can be utilized to forecast future trends and behaviors of a system based on historical data.
Key Concepts and Elements
1. Stocks:
- Definition: Stocks are quantities measured at a specific point in time, representing the accumulation of a quantity over time. They exist at a particular moment, such as the balance date.
- Units: Stocks are measured in units that represent the quantity at a specific point in time (e.g., dollars, machines, inventory).
2. Flows:
- Definition: Flows are quantities measured over an interval of time. They represent the rate at which a quantity is added or subtracted from a stock over time.
- Units: Flows are measured per unit of time (e.g., dollars per year, machines per month).
3. Diagram Elements:
a. Stock (Rectangle):
- Represents a stock variable.
- Typically labeled with the name of the stock (e.g., “Capital Stock”).
- Initial value can be specified if needed.
b. Flow (Arrow):
- Represents a flow variable.
- Arrows indicate the direction of the flow (inflow or outflow).
- Labeled with the name of the flow (e.g., “Investment”).
- Flow rate (e.g., dollars per year) can be specified.
c. Converter (Circle):
- Represents a process that transforms one flow into another or changes the stock.
- Labeled with the process description (e.g., “Depreciation”).
- May have a conversion rate or formula associated with it.
d. Connector (Lines):
- Connects stocks, flows, and converters to show their interactions.
- Arrows indicate the direction of flow or influence.
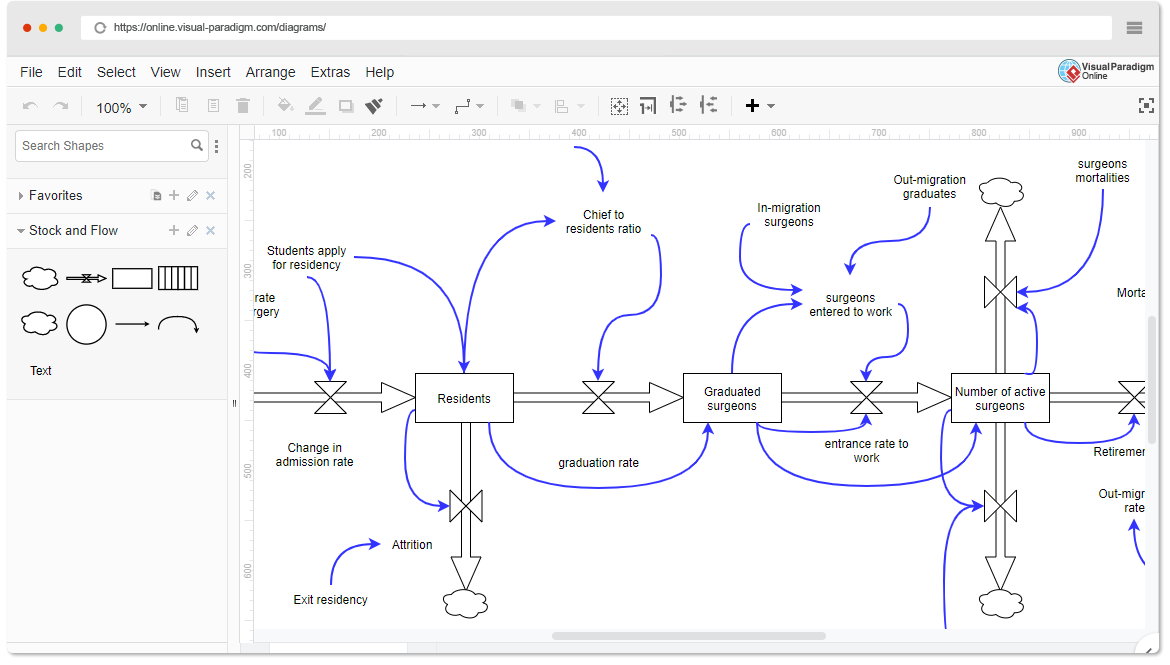
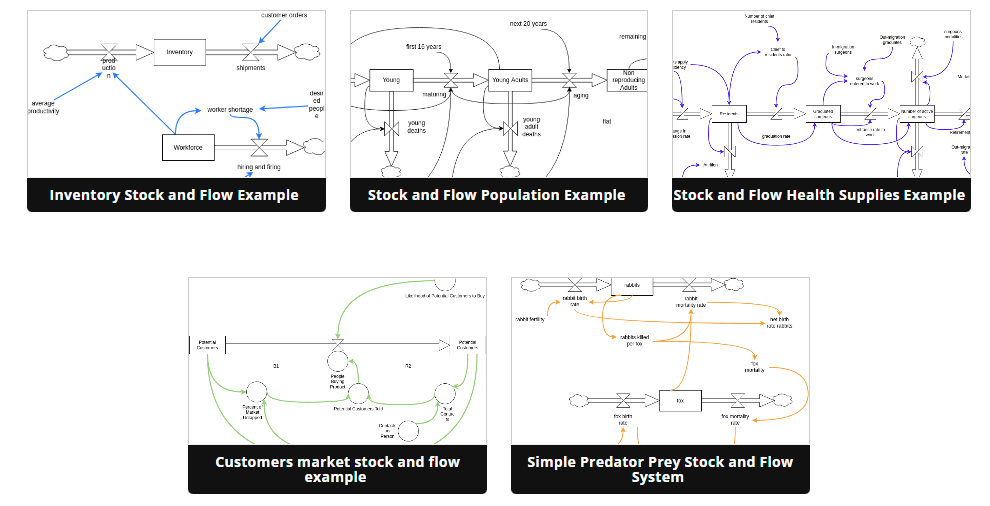
Examples Using Visual Paradigm Online Templates
Visual Paradigm Online offers pre-made templates for creating Stock and Flow Diagrams. Here are two examples:
Example 1: Economic System
Scenario:
You want to model an economic system that includes capital stock, investment, and depreciation.
- Open Visual Paradigm Online and select a Stock and Flow Diagram template.
- Add a “Capital Stock” stock element and specify its initial value.
- Add an “Investment” flow element that contributes to the capital stock.
- Add a “Depreciation” converter element to represent the depletion of the capital stock.
- Connect the elements with arrows to indicate the flow of investment and the impact of depreciation on the capital stock.
- Label arrows with appropriate units (e.g., dollars/year).
- Analyze the diagram to understand how investment and depreciation affect the capital stock over time.
Example 2: Population Growth
Scenario:
You want to model the population growth of a city, taking into account births, deaths, and immigration.
- Open Visual Paradigm Online and select a Stock and Flow Diagram template.
- Add a “Population” stock element and specify its initial value.
- Add “Births,” “Deaths,” and “Immigration” flow elements that contribute to or subtract from the population.
- Connect the elements with arrows to represent the flows of births, deaths, and immigration.
- Label arrows with appropriate units (e.g., people/year).
- Analyze the diagram to understand how births, deaths, and immigration impact the city’s population growth.
Stock and Flow Diagrams are invaluable tools for understanding and modeling complex dynamic systems in various fields. Whether you are analyzing economic systems, ecological processes, or business operations, these diagrams can provide insights into how different variables interact and change over time. Visual Paradigm Online simplifies the process of creating these diagrams, allowing you to focus on modeling and analysis.
This post is also available in Deutsche, Español, فارسی, Français, English, Bahasa Indonesia, 日本語, Polski, Portuguese, Ру́сский, Việt Nam, 简体中文 and 繁體中文.
