


Comprehensive Guide to Value-Stream Mapping
Value-stream mapping (VSM) is a powerful lean management technique used to analyze, optimize, and visualize the flow of materials and information in a specific process or value stream. This comprehensive guide will cover the purpose, key concepts, essential elements, and provide examples using pre-made templates available in Visual Paradigm Online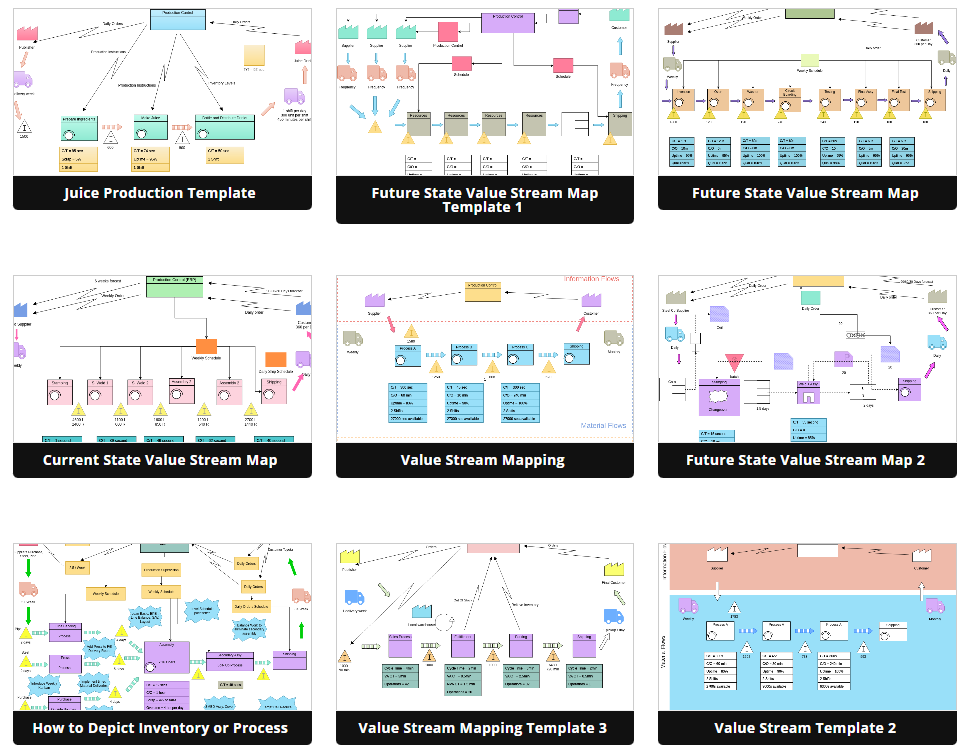
1. Introduction to Value-Stream Mapping
1.1 Purpose of Value-Stream Mapping
The primary purpose of value-stream mapping is to identify and eliminate or reduce waste in a specific process or value stream. This waste reduction aims to increase the efficiency of operations, enhance productivity, and make it easier to identify and address quality issues. By mapping the flow of materials and information, organizations gain insights into how to streamline their processes.
1.2 Applications of Value-Stream Mapping
Value-stream mapping is a versatile tool used in various industries and domains, including:
- Manufacturing: To optimize production processes.
- Logistics and Supply Chain: To improve the flow of goods.
- Service Industries: To enhance service delivery.
- Healthcare: To optimize patient care processes.
- Software Development: To streamline development cycles.
- Product Development: To create more efficient development processes.
- Project Management: To optimize project workflows.
- Administrative and Office Processes: To improve office operations.
2. Key Concepts in Value-Stream Mapping
2.1 Identifying Waste
One of the core objectives of value-stream mapping is the identification and elimination of waste. Waste refers to any activity or process that does not add value to the customer.
2.2 Types of Waste
Daniel T. Jones identified seven common types of waste, often referred to as the “7 Wastes” or “Muda”:
- Faster-than-necessary pace: Overproduction that damages production flow.
- Waiting: Time when goods are not being transported or worked on.
- Conveyance: Excessive movement of goods.
- Processing: Overly complex solutions for simple procedures.
- Excess Stock: Overabundance of inventory.
- Unnecessary Motion: Excess physical effort by employees.
- Correction of Mistakes: Costs associated with defects or their correction.
2.3 Waste Removal Operations
Yasuhiro Monden identified three types of operations in value-stream mapping:
- Non-value Adding Operations (NVA): Actions that should be eliminated.
- Necessary but Non-value Adding (NNVA): Actions that are wasteful but currently necessary.
- Value-Adding (VA): Operations that contribute to customer requirements.
3. Creating Value-Stream Maps: Learn by Examples
3.1 Visual Paradigm Online
Visual Paradigm Online is a user-friendly online diagramming tool that offers pre-made templates for creating value-stream maps. It simplifies the process of designing and sharing value-stream maps with your team.
3.2 Example 1: Manufacturing Value-Stream Map
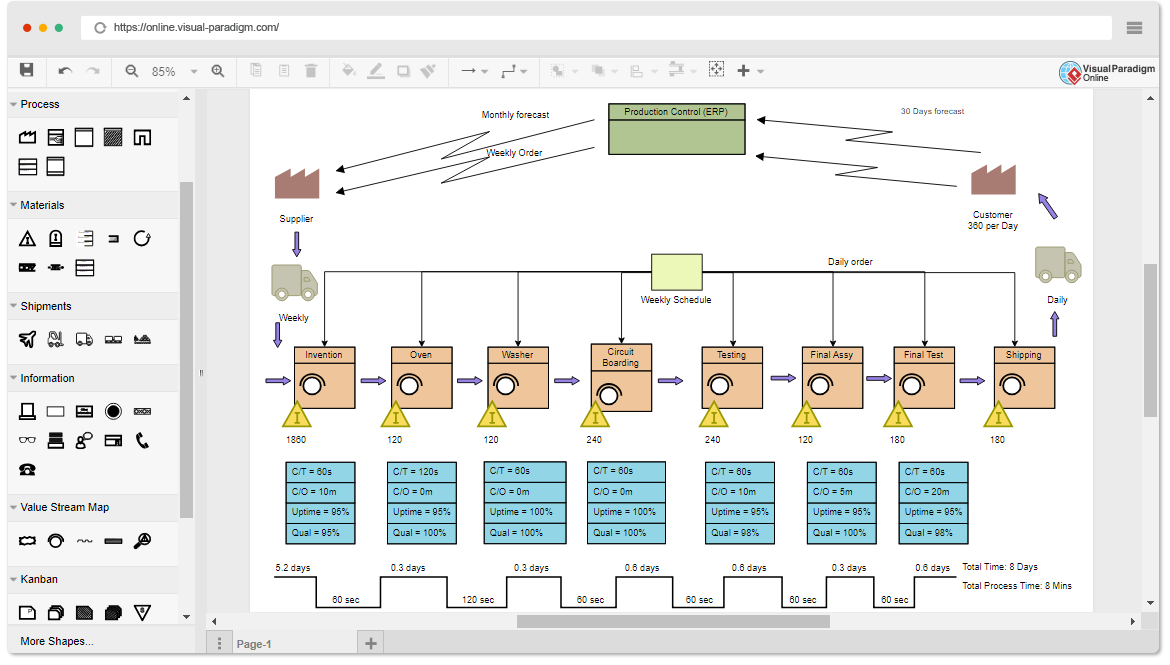
Let’s use Visual Paradigm Online to create a manufacturing value-stream map for a fictional company called “ABC Widgets.”
- Access Visual Paradigm Online: Start by signing in to Visual Paradigm Online or creating a free account.
- Select a Template: Choose the “Value-Stream Mapping” template from the template library.
- Customize the Map: Replace the placeholders with relevant information about ABC Widgets’ manufacturing process. Include process steps, cycle times, inventory levels, and information flows.
- Visualize the Map: Use symbols and connectors to represent materials, information flow, and process steps. Ensure that you accurately depict the current state of the value stream.
- Identify Waste: Analyze the map to identify areas of waste, such as excess inventory or waiting times. Highlight these areas for improvement.
- Design Future State: Create a second value-stream map to represent the desired future state of the process, incorporating improvements to reduce waste.
- Share and Collaborate: Share the value-stream maps with your team, gather feedback, and collaborate on implementing improvements.
3.3 Example 2: Service Industry Value-Stream Map
Let’s explore another example for a service industry company, “XYZ Financial Services.” Follow similar steps as in Example 1 to create a value-stream map for XYZ Financial Services’ customer onboarding process.
Visual Paradigm Online provides the flexibility to adapt value-stream mapping to various industries and processes, making it a valuable tool for continuous improvement.
In conclusion, value-stream mapping is a powerful technique used to visualize, analyze, and optimize processes in various industries. By identifying and eliminating waste, organizations can enhance efficiency, reduce costs, and improve overall customer satisfaction. Visual Paradigm Online simplifies the creation of value-stream maps, making it accessible for teams across different domains to streamline their operations and drive continuous improvement.
This post is also available in Deutsche, Español, فارسی, Français, English, Bahasa Indonesia, 日本語, Polski, Portuguese, Ру́сский, Việt Nam, 简体中文 and 繁體中文.
