


Comprehensive Tutorial on Robustness Diagrams
Introduction
Robustness analysis is a crucial step in software design, bridging the gap between the understanding of what a system needs to accomplish (analysis) and how it will be implemented (design). It helps designers make assumptions about the system’s design and think about possible technical solutions. One valuable tool in robustness analysis is the Robustness Diagram, introduced by Rosenberg and Stephen in 2007. While not part of the official UML specification, robustness diagrams leverage UML concepts to represent the behavior of a system. In this tutorial, we will delve into the principles, elements, and practical use of robustness diagrams.
Elements of a Robustness Diagram
A robustness diagram combines elements of both class diagrams and activity diagrams. It visually represents the behavior of a use case, highlighting the participating classes and the software behavior without specifying which class is responsible for each part of the behavior. This makes it easier to comprehend than traditional activity diagrams as it focuses on the interaction between objects. Let’s explore the key elements of a robustness diagram:
Stereotyped Objects
Robustness diagrams use stereotyped objects to represent different types of elements within the system. The following UML stereotypes are commonly employed:
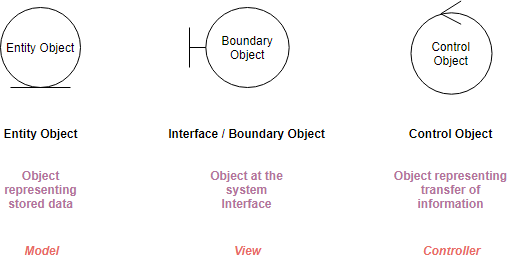
- «boundary»: Represents the interface between the system and the external world. Boundary objects typically correspond to screens, web pages, or other user interfaces with which actors interact. These objects are associated with the presentation layer.
- «entity»: Denotes objects from the domain model, which represent real-world entities or concepts within the system.
- «control»: Serves as the intermediary between boundary and entity objects, acting as the “glue” that coordinates their interactions.
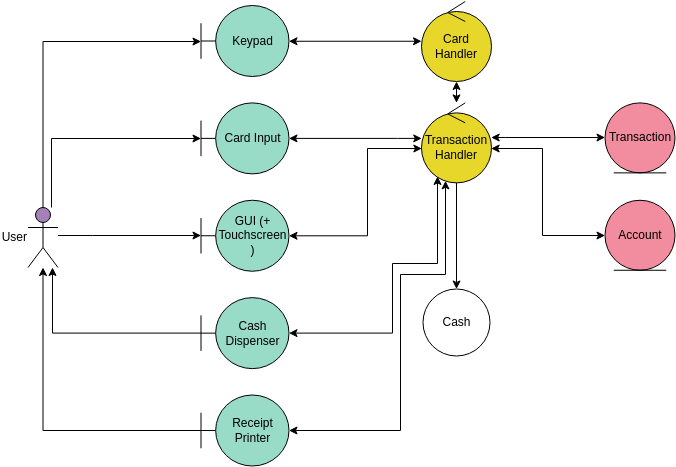

MVC Robustness Diagram Example:
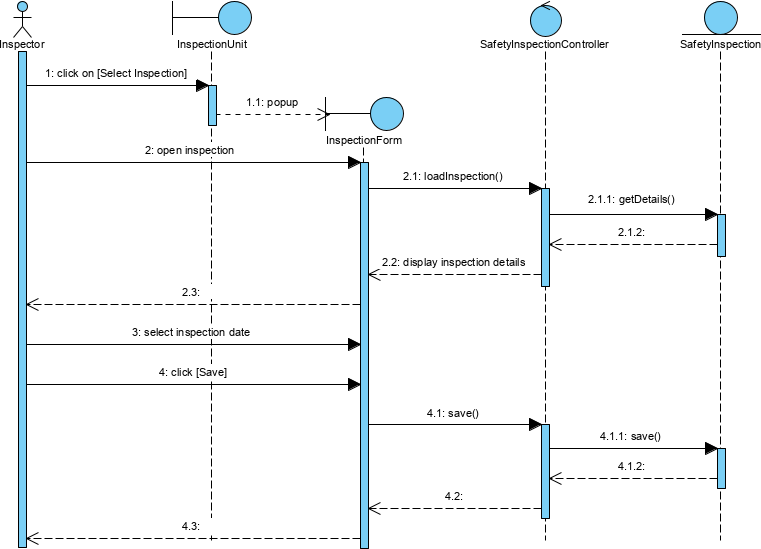
In the context of MVC sequence diagrams, these elements come together to execute commands initiated from the system’s boundaries, orchestrating interactions with entities through boundary objects. Typically, a controller object aligns with a specific use case scenario, often represented visually through a sequence diagram.
To enhance the clarity and understanding of MVC sequence diagrams, it’s beneficial to employ stereotypes for the lifelines of the diagram’s elements. This practice helps visually distinguish the types of objects used in the MVC, creating a representation that aligns with the principles established in the Robustness Analysis Diagram.
Conclusion
Robustness diagrams, although not part of the official UML specification, serve as a valuable tool in robustness analysis during software design. They help bridge the gap between analysis and design by visually representing the interaction between system objects. By following the principles and rules outlined in this tutorial, designers can create effective robustness diagrams that provide clarity and structure to their use cases, ultimately leading to better software design and development.
Resources
This post is also available in Deutsche, Español, فارسی, Français, English, Bahasa Indonesia, 日本語, Polski, Portuguese, Ру́сский, Việt Nam, 简体中文 and 繁體中文.
