Customize the Word Wrap in your Treemap

Treemap is a type of data visualization using nested rectangles to represent hierarchical data. It displays data in a hierarchical structure, where each rectangle represents a category or group, and the size of the rectangle corresponds to a specific attribute or value. Treemaps provide a visually appealing and intuitive way to explore complex data relationships and patterns, making them popular in various industries for analyzing and presenting data in a meaningful and insightful manner.
Visual Paradigm Online Chart Maker is a powerful tool for you to create Treemap easily. In this article, we will show you how to customize the Treemap by editing its Word Wrap.
About Word Wrap
Word wrap in treemaps refers to the text labels within the rectangles of a treemap. Word wrap is important in treemaps as it helps enhance the readability and interpretability of the visualization by displaying complete labels for each category or group within the treemap. It enables users to accurately understand the hierarchy, relationships, and proportions of the data being visualized, making it easier to extract meaningful insights from the treemap.
Proper design of word wrap in treemaps ensure that the text labels are displayed in a visually pleasing manner, making the treemap more effective as a communication and decision-making tool for data analysis, reporting, and presentation purposes.
Customize Word Wrap in Treemap
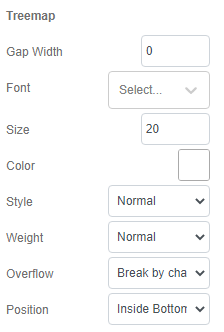
Under Chart Panel, we can find the Treemap section.
We can edit the text font, size, color, etc.

Overflow of the Word Wrap
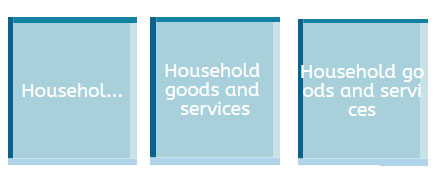
By default, the caption will show in truncate mode, which cut away to text which can’t fit into the cell. We can find more choice under Overflow, including Break by word and Break by character. Try to find the best way to show your words.

Position of Word Wrap
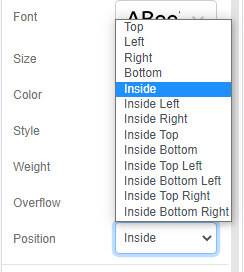
Under Position, we can select the position of the word wrap shown in the Treemap. By default, the caption will show at the middle of the cell. We can choose to place the word in place that fit the design and also the composition of the rectangles.

Common use of Treemap
Treemaps are a powerful data visualization technique that can help you gain insights and make informed decisions in various domains. Here are some situations where treemaps can be effectively utilized.
- Financial analysis: Treemaps can be used to represent financial data, such as portfolio allocation, asset distribution, and expenditure breakdowns. They provide a visual overview of how resources are allocated or distributed, helping to identify trends, outliers, and opportunities for optimization.
- Inventory management: Treemaps can be used to visualize inventory data, such as product categories, stock levels, and sales performance. They can help identify best-selling products, slow-moving items, and overstocked items, enabling better inventory management decisions.
- Website analytics: Treemaps can be used to visualize website analytics data, such as traffic sources, pageviews, and conversion rates. They provide insights into website performance, user behavior, and content engagement, helping to optimize website design and marketing strategies.
- Project management: Treemaps can be used to represent project data, such as task assignments, deadlines, and progress tracking. They provide a visual overview of project status, resource allocation, and task dependencies, helping project managers to efficiently monitor and manage project progress.
- Risk assessment: Treemaps can be used to visualize risk assessment data, such as risk categories, severity levels, and mitigation strategies. They provide a visual representation of risk exposure and mitigation efforts, aiding in risk management and decision-making.
- Social network analysis: Treemaps can be used to represent social network data, such as relationships, connections, and interactions among individuals or groups. They provide insights into network structure, centrality, and community detection, aiding in social network analysis and understanding complex social dynamics.

This post is also available in Deutsche, English, Español, فارسی, Français, Bahasa Indonesia, 日本語, Polski, Portuguese, Ру́сский, Việt Nam, 简体中文 and 繁體中文.


