


Dendrogram: The Ultimate Guide to Organizing Data Visually
Dendrogram is a visual representation of data that displays the hierarchy and relationships among elements in a clear and concise way. It is commonly used in fields such as biology, linguistics, sociology, and information technology to help visualize and understand complex data structures. In this article, we will explore the benefits of using dendrogram, when to create one, and how to create stunning dendrogram using Visual Paradigm Online.

What is Dendrogram?
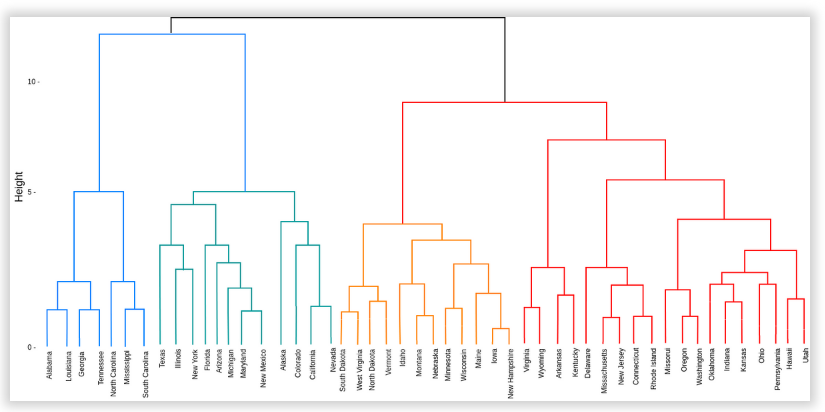
A dendrogram is a tree-like diagram that displays the relationships between elements in a hierarchical structure. The elements are represented as nodes, and the relationships are displayed as branches connecting the nodes. The topmost node is called the root node, while the bottommost nodes are called leaves.
When to Create Dendrogram?
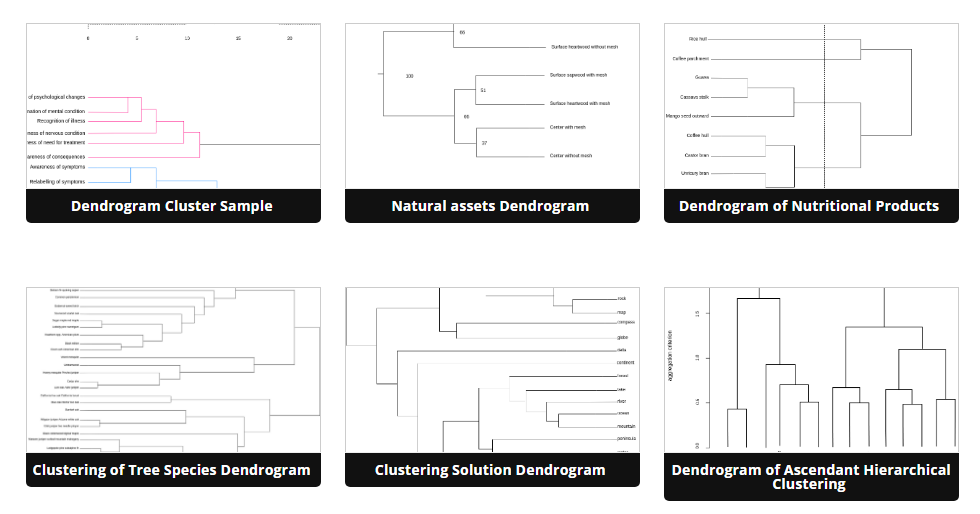
Dendrogram can be used in various scenarios where data has a hierarchical structure. For example, it can be used to display the relationships between different species in biology, to show the relationships between words in linguistics, or to display the structure of a software system. Dendrogram is also useful for visualizing the clustering results in data analysis and machine learning.
Benefits of Dendrogram
- Visualizing Hierarchical Relationships: Dendrogram helps to clearly display the relationships between elements, making it easier to understand and analyze complex data structures.
- Identifying Clusters: Dendrogram can be used to identify and highlight clusters of similar elements, making it easier to see patterns and relationships within the data.
- Easy to Read: The tree-like structure of dendrogram makes it easy to read and understand, even for complex data structures.
- Saving Time: Creating dendrogram helps to quickly identify the relationships between elements, saving time and effort compared to manual analysis.
Creating Stunning Dendrogram with Visual Paradigm Online
Visual Paradigm Online is an online diagramming tool that makes it easy to create stunning dendrogram.
With its intuitive drag-and-drop interface and wide range of customization options, you can create professional-looking dendrogram in just a few clicks.
- Visit your Visual Paradigm Online workspace and click on Create New.
Search for Dendrogram and then select it to create one. - Drag and drop nodes from the palette to the canvas.
- Connect the nodes to create the hierarchy and relationships.
- Customize the appearance of the dendrogram using the rich set of formatting options.
- Save and share your dendrogram with others.
Conclusion
In conclusion, dendrogram is a powerful tool for visualizing hierarchical relationships and identifying clusters within data. By using Visual Paradigm Online to create stunning dendrogram, you can quickly and easily analyze complex data structures and gain insights that would otherwise be difficult to uncover.
This post is also available in Deutsche, Español, فارسی, Français, English, Bahasa Indonesia, 日本語, Polski, Portuguese, Ру́сский, Việt Nam, 简体中文 and 繁體中文.
