


Elevate Your Data Visualization: Seamless Chart Transformation with Visual Paradigm Online
Effective data visualization holds immense power in today’s swiftly changing digital environment, serving as a crucial conduit for conveying meaningful insights. Visual Paradigm Online introduced the effortless transformation of charts, all without the hassle of recreating them. This advancement not only streamlines the process but also ensures the unwavering integrity of your data.

The Power of Data Visualization in Business
Data visualization serves as a cornerstone in modern business strategies, enabling organizations to make informed decisions and drive growth. In a data-driven landscape, businesses grapple with vast amounts of information daily. This is where the art of data visualization comes into play. By transforming raw data into visually engaging charts and graphs, complex insights can be distilled into easily digestible formats. These visual representations not only facilitate comprehension but also unveil patterns, trends, and correlations that might otherwise remain hidden in spreadsheets and databases
- Step 1: Selecting Your Chart
When you enter the design editing mode, start by selecting the chart you want to modify. Whether it’s a bar chart, pie chart, line graph, or any other data representation, Visual Paradigm Online provides a wide range of options to suit your needs.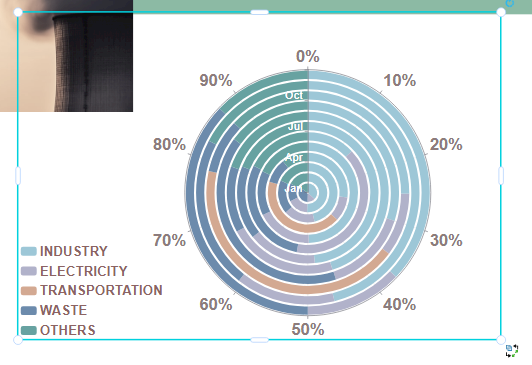
- Step 2: Initiating the Transformation
Within the user-friendly editing interface, you’ll find the “Switch Type” button – your portal to chart transformation. A simple click opens up a world of design possibilities. This action initiates the chart transformation process, facilitating a smooth transition to a different chart type.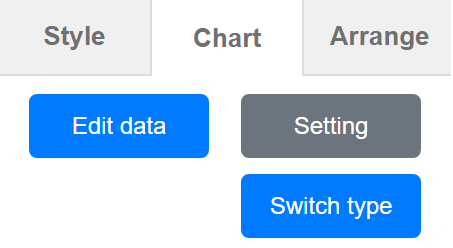
- Step 3: Embracing the Transformation
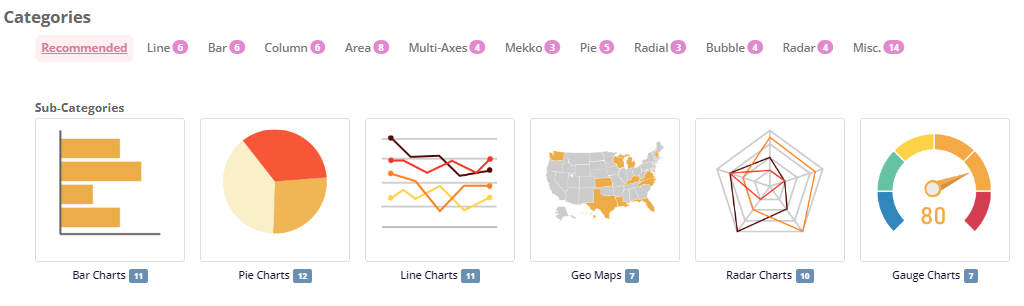
Once the transformation process begins, the platform guides you to select the new chart type. This curated selection includes diverse visualizations to accurately convey your data’s nuances. The transformation encompasses visual style, layout, and labeling, creating a comprehensive shift.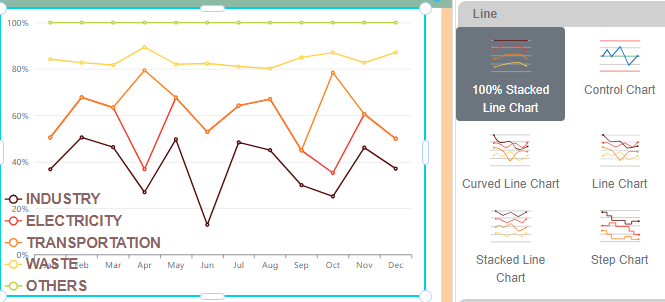
Preserving Data Integrity
Maintaining data integrity during chart transformation is vital. Visual Paradigm Online ensures that your data remains unchanged throughout the transition. This feature eliminates the need for manual data re-entry or reformatting, allowing you to focus on creativity.
Unlocking New Possibilities
Seamless chart transformation brings a host of advantages for designers, analysts, and communicators:
- Rapid Iteration: Effortlessly switch between chart types to identify the most effective visualization for your data.
- Enhanced Communication: Different chart types excel at conveying distinct insights, allowing you to tailor visualizations for better audience resonance.
- Time Efficiency: Chart transformation eliminates redundant manual work, saving time for refining your design.
- Data-Driven Design: Explore various chart types to make design decisions rooted in your data, leading to accurate and impactful visualizations.
In the dynamic realm of data visualization, adaptability is crucial. Visual Paradigm Online’s chart transformation feature empowers designers to evolve their visualizations with agility and efficiency. By enabling seamless transitions between chart types while safeguarding data integrity, this tool transforms the design process into a fluid, iterative journey. Embrace the power of chart transformation and unlock a world of design possibilities. Visual Paradigm Online helps you tell your data’s story in a compelling and versatile way.
This post is also available in Deutsche, Español, فارسی, Français, English, Bahasa Indonesia, 日本語, Polski, Portuguese, Ру́сский, Việt Nam, 简体中文 and 繁體中文.
