


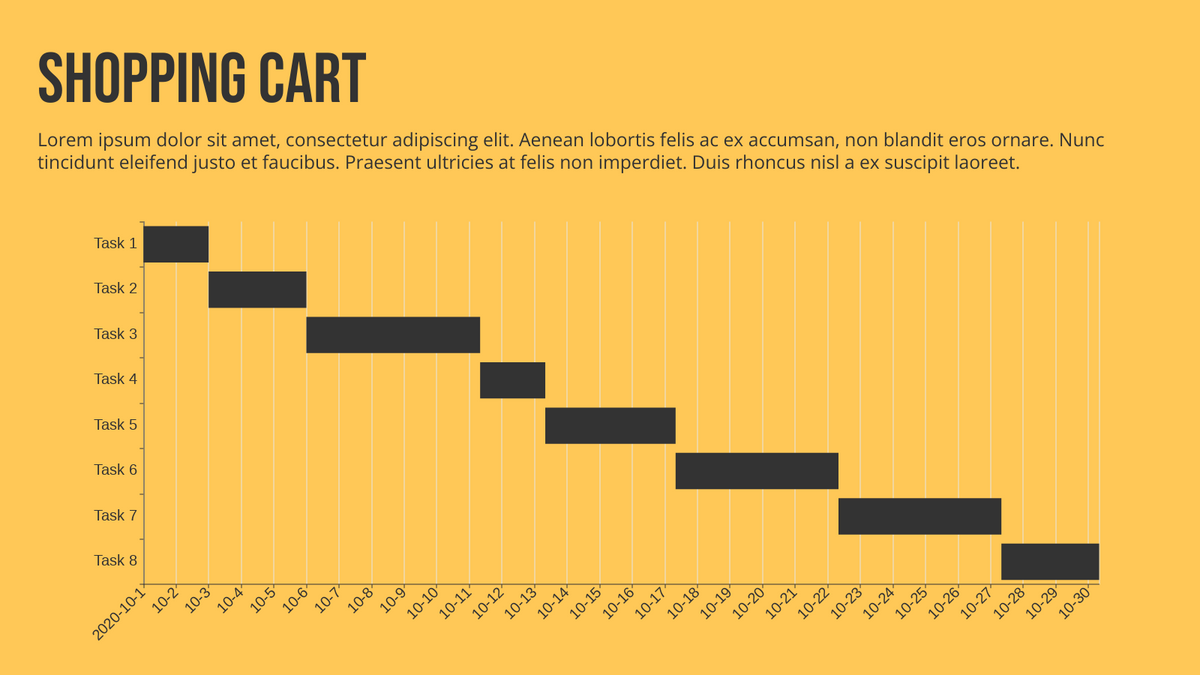
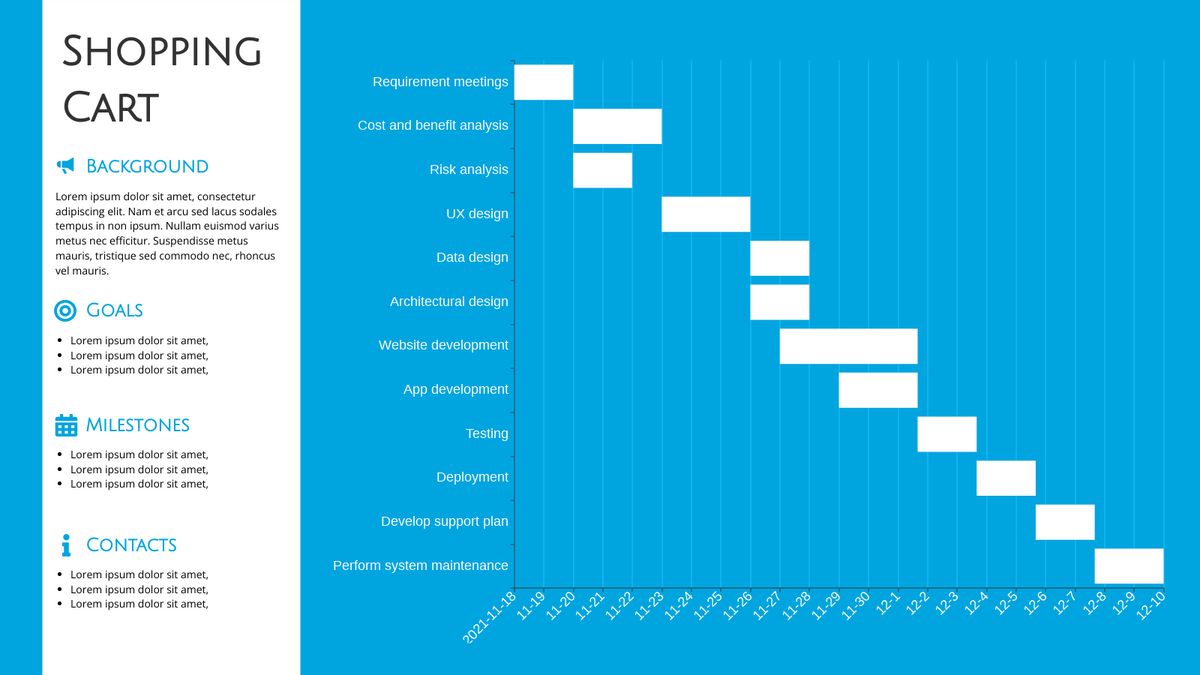
How to Create a Simple Gantt Chart
Gantt charts help teams to plan work around deadlines and properly allocate resources. Turn your raw data into beautiful charts with our online Gantt chart maker. Visual Paradigm Online features a rich collection of chart types and chart templates. Create your chart easily and quickly now!
The steps are as follow:
- Click on charts panel on the left and select gantt chart

- Drag the chart to the centre of canvas and alter the size
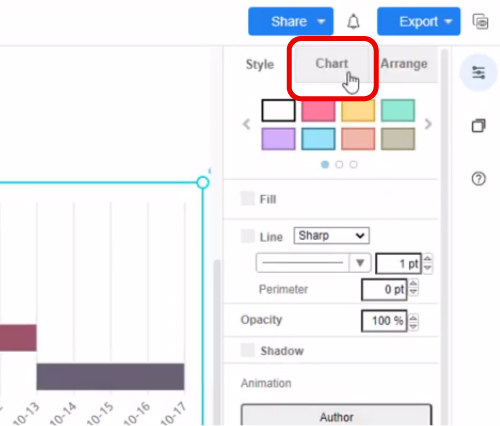
- Click on chart panel on “your right” and select edit data
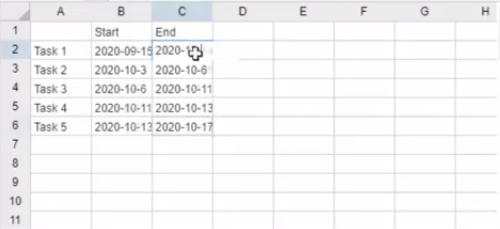
- Replace the old data with your own data
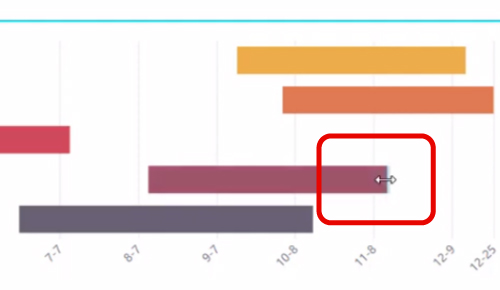
- You can also drag on the data bar to adjust the data
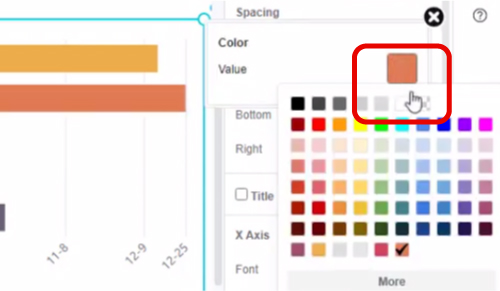
- Edit your chart style including the chart color and font
- Finalise your chart and save
Looking for some Gantt chart sample? Click visual paradigm online!!!
This post is also available in Deutsche, Español, فارسی, Français, English, Bahasa Indonesia, 日本語, Polski, Portuguese, Ру́сский, Việt Nam, 简体中文 and 繁體中文.
