


How to Create Organization Chart using Visual Paradigm Smart Board
Visual Paradigm Online is a powerful and user-friendly diagramming tool that offers a wide range of features to create professional-quality visual representations. One of its key features, the Smart Board, provides a seamless and intuitive way to create organizational charts. With Visual Paradigm Smart Board, users can easily design and customize organizational charts, depicting the hierarchical structure of their organizations. This tool allows users to add nodes, edit text content, and apply various styles to create visually appealing and informative charts. In this article, we will explore the step-by-step process of creating an Organization Chart using Visual Paradigm Smart Board in Visual Paradigm Online, along with tips on customizing the chart’s appearance and exporting it in different formats.
Accessing the Smart Board and Creating a New Chart
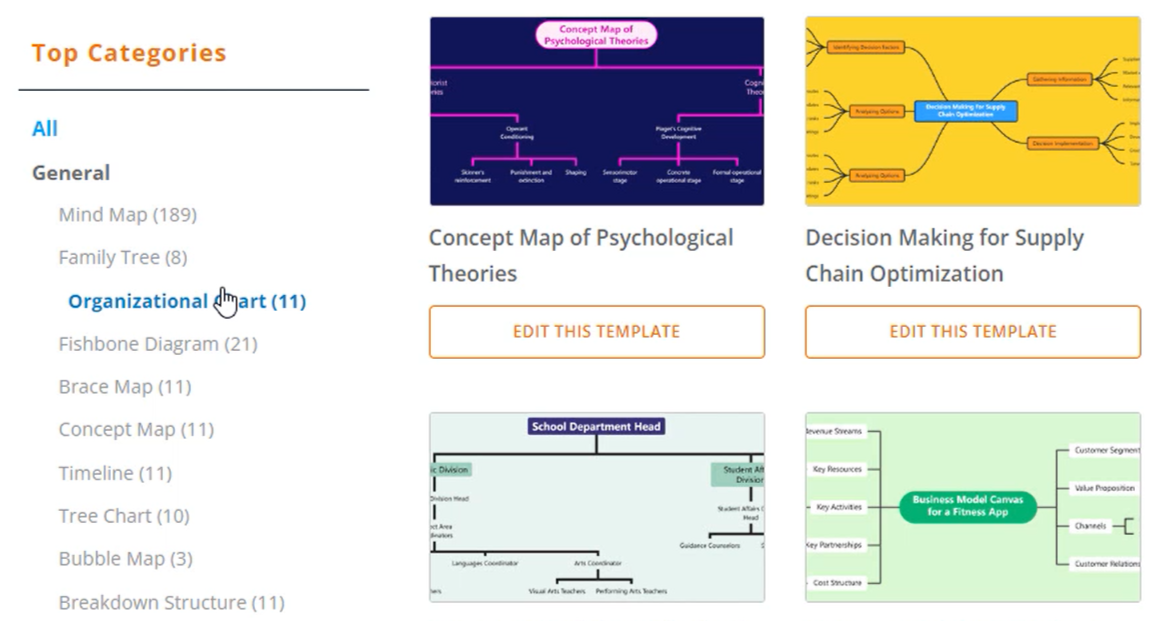
To begin creating an Organization Chart using Visual Paradigm Smart Board in Visual Paradigm Online, first, access your workspace. Once inside, locate and access the Smart Board feature. Within the Smart Board, click on the “Create New” button to initiate the creation process. From the list of available options, select “Organizational Chart” to create a new organizational chart.
Editing the Chart and Adding Nodes
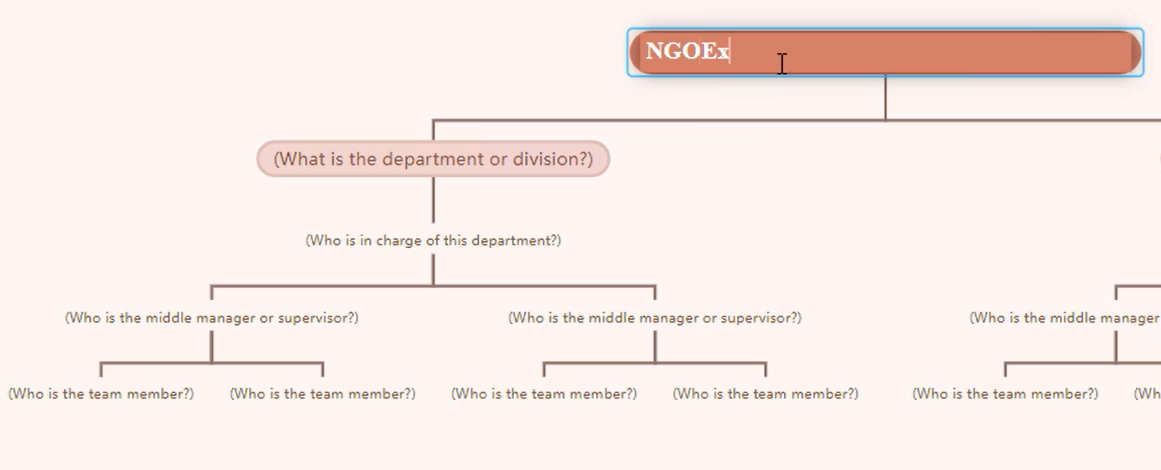
After creating the organizational chart, you can proceed to edit it. Double-click on a node within the chart to modify its text content and make any necessary changes. To add sibling nodes, press the “Enter” key, which will insert a new node at the same hierarchical level as the current node. Similarly, use the “Tab” key to add child nodes, which will create a new node as a child of the current node. Alternatively, you can also utilize the buttons provided in the toolbar to add nodes.
Customizing the Style of the Chart
Visual Paradigm Online offers various customization options to style your organizational chart. By accessing the theme palette, you can change the overall style of the chart using the available theme packages. These packages provide predefined styles to choose from. Additionally, the base style allows you to customize the background of the chart, while the node style enables you to change the color of individual nodes to suit your preferences.

Exporting the Chart as an Image
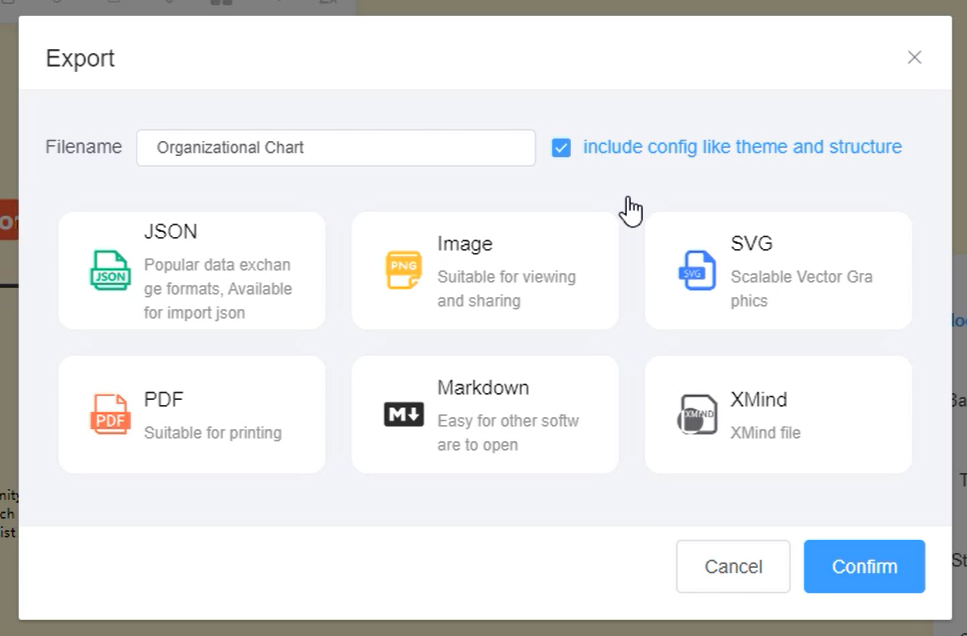
Once you have finished creating and editing your organizational chart, it’s time to export it. To do this, select the “Export” option within the Smart Board. From the export options, choose the “Image” format. This will save the chart as a PNG image file, which can be easily shared or used in other documents and presentations.
Saving the Chart in JSON Format
In addition to exporting as an image, Visual Paradigm Online allows you to save the organizational chart in JSON format. This format preserves the structure and content of the chart in a machine-readable form, facilitating further analysis or integration with other tools. Saving in JSON format ensures that you can revisit and modify the chart in Visual Paradigm or other compatible software in the future.
By following these steps and utilizing the features offered by Visual Paradigm Smart Board in Visual Paradigm Online, you can create an organized and visually appealing Organization Chart to represent and communicate the structure of your organization effectively.
With Visual Paradigm Smart Board, users can easily design and customize organizational charts, depicting the hierarchical structure of their organizations. This tool allows users to add nodes, edit text content, and apply various styles to create visually appealing and informative charts. In this article, we will explore the step-by-step process of creating an Organization Chart using Visual Paradigm Smart Board in Visual Paradigm Online, along with tips on customizing the chart’s appearance and exporting it in different formats.
This post is also available in Deutsche, Español, فارسی, Français, English, Bahasa Indonesia, 日本語, Polski, Portuguese, Ру́сский, Việt Nam, 简体中文 and 繁體中文.
